Demography of Rural marketing: Population, Occupation Pattern, literacy rate, Income source, Expenditure Pattern, Rural Demand and Consumption pattern, Rural Housing, Education, Electricity, Roads.
Introduction
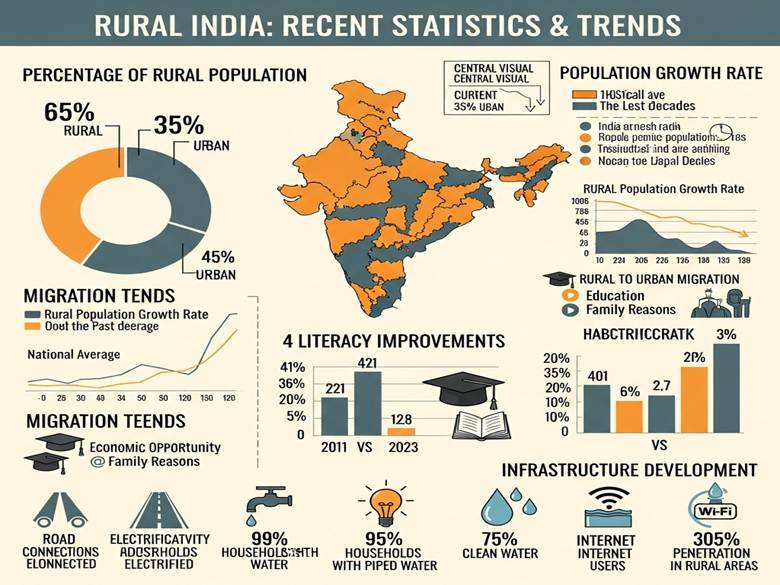
Rural marketing in India targets the vast demographic of approximately 65-68.84% of the population residing in rural areas, where over 900 million people live across diverse villages, influencing consumption patterns for FMCG, agri-inputs, durables, and services. Key characteristics include a youthful skew, rising but uneven incomes, improving literacy, and seasonal employment dominated by agriculture, making value-for-money products and localized strategies essential.
1. Population
India’s rural population constitutes approximately 63-65% of the total 1.41 billion (2025 estimates), equating to over 900 million people across 6.27 lakh villages, though this share is declining due to urbanization (from 68.84% in 2011). Rural areas drive 40-50% of national consumption, with a youthful demographic (55% under 25) and improving infrastructure boosting market potential.
Recent data highlights significant trends in India’s rural population:
- Declining Rural Proportion: In 2024, rural areas accounted for 63.1% of India’s total population, a decrease from 63.4% in 2023. This reflects ongoing urbanization, with the rural share having declined from 81.5% in 1960. (helgilibrary.com)
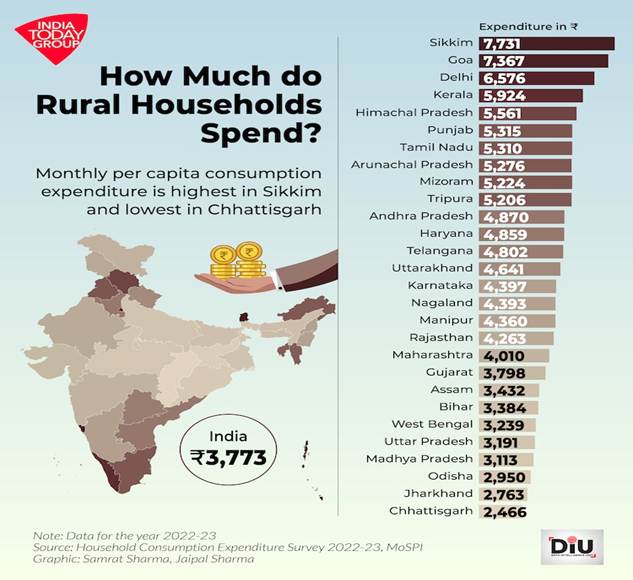
- Economic Growth: Rural consumption has been rising steadily, narrowing the urban-rural expenditure gap. In 2023-24, the average monthly per capita consumption expenditure (MPCE) in rural areas was ₹4,122, up 9% from the previous year. This growth is particularly notable among the bottom 5-10% of the population, indicating more equitable economic development. (ddnews.gov.in)
- Poverty Reduction: Rural poverty has significantly decreased, dropping to 4.86% in the fiscal year ending March 2024, down from 25.7% in 2011-12. This improvement is largely attributed to government support programs and increased consumption. (timesofindia.indiatimes.com)
- Employment Trends: The unemployment rate in rural areas fell to 4.4% in the July-September 2025 quarter, aided by seasonal agricultural employment and a rise in female workforce participation. (reuters.com)
These developments underscore the dynamic nature of India’s rural demographics, influenced by urban migration, economic policies, and social changes.
Rural Population Overview Table (2024-25 Estimates)
| Metric | Value/Percentage | Details/Trends |
| Total Rural Population | ~916-920 million (63.13%) | Down from 833M (68.84%) in 2011; growth rate ~0.9% annually. |
| Male Rural | ~470 million (51.2%) | Sex ratio 950 females/1000 males. |
| Female Rural | ~446 million (48.8%) | Rising female LFPR in non-farm sectors. |
| Share of National Population | 63.13% (2024) | Projected to fall to ~60% by 2030. |
| Density | ~300-400/sq km (varies regionally) | High in Indo-Gangetic plains; low in central India. |
| Household Size (Avg.) | 4.5-5 persons | Nuclear families rising in semi-rural. |
| Youth (Under 25) | 55% | Drives digital/FMCG demand. |
State-wise, UP (155M+ rural), Bihar (110M+), Maharashtra (60M+) lead; urbanization fastest in south/west. This base supports rural marketing via haats/digital.
2. Occupation Pattern
Agriculture remains the dominant occupation in rural India, employing nearly 60% of the rural workforce, but non-farm sectors like construction, manufacturing, and trade are growing rapidly, reflecting diversification amid stagnant farm productivity. Between 2011-12 and 2023-24, agricultural employment fell from 63.3% to 57.6%, while non-farm jobs rose from 36.9% to 42.4%, driven by schemes like MGNREGA, remittances, and urbanization pressures.
- Agriculture is the primary occupation for about 50-55% of the rural workforce.
- Allied activities such as dairy, poultry, fishing, and forestry supplement income.
- Increasing diversification with non-farm activities like small-scale industries, handicrafts, and service sector jobs.
- Seasonal migration to urban areas for additional income is common.
- Self-employment is a significant component of rural livelihoods.
Key Occupation Patterns
| Sector/Sub-Sector | Workforce Share (2023-24) | Characteristics and Trends |
| Agriculture & Allied | ~57.6-60% | Dominant for both genders; 73% self-employed (own-account/family labor). Declining due to fragmentation; females 70.9% in Q1 2025. Includes crops, dairy, fisheries. |
| Construction | ~10-15% (top non-farm) | Major non-agri employer; male-heavy, seasonal/migratory; boosted by infra projects. |
| Manufacturing | ~8-10% | Rural SMEs, agro-processing; rising with PLI schemes. Younger workers prefer. |
| Wholesale/Retail Trade | ~7-9% | Haats, kirana shops; female participation growing in trade/education. |
| Services (Health/Edu) | ~5-7% | Emerging for educated females; gig jobs via apps. |
| Others (MGNREGA/Wages) | ~10-15% | Distress employment; 44.6% rural males in agri/services Q1 2025. |
Gender and Age Dynamics
- Males: Shifting to non-farm (construction/trade); prime-age (25-45) lead diversification.
- Females: 75%+ in agri; rising in health/education (e.g., ASHA workers); LFPR varies (37.2% national rural avg).
- Youth (Under 35): Prefer non-farm; higher education correlates with mobility.
This shift supports rural marketing by stabilizing incomes for durables/FMCG, though seasonal unemployment demands credit-linked, harvest-timed strategies.
3. Literacy Rate
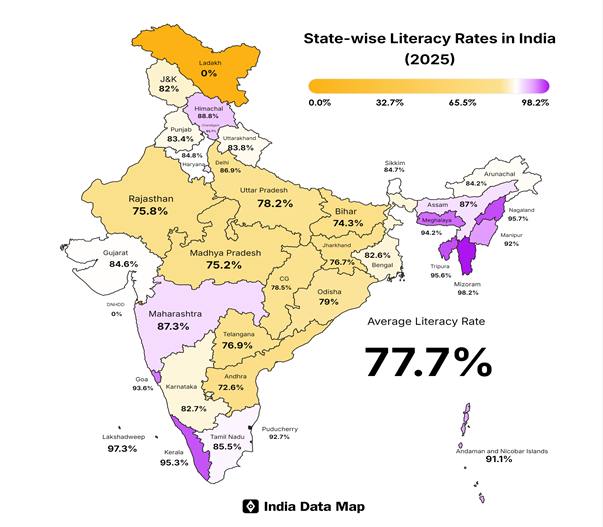
Rural India’s literacy rate for individuals aged 7 and above stands at 77.5% as of 2023-24, marking a significant 10 percentage point rise from 67.77% in 2011, driven by schemes like Samagra Shiksha and ULLAS (Nav Bharat Saaksharta Karyakram). This progress lags behind urban India’s 88.9%, with a persistent gender gap: male literacy at 84.7% (up from 77.15%) and female at 70.4% (up from 57.93%). Regional disparities are stark, with southern states like Kerala exceeding 95% while Bihar and Rajasthan hover below 73% in rural areas.
- Rural literacy has been steadily improving but remains lower than urban literacy.
- As per latest data, rural literacy is around 70-75%, with a gender gap favoring males.
- Educational infrastructure is growing, with increased enrollment in primary and secondary schools.
- Literacy improvements contribute to better awareness and media access, influencing rural consumption.
Gender and Age Breakdown
- Males: 84.7% literate, benefiting from higher school enrollment and labor migration exposure.
- Females: 70.4%, showing faster growth due to targeted interventions like Beti Bachao Beti Padhao and female teacher recruitment; however, dropout rates remain higher post-primary.
- Youth (7-25 years): Over 85-90% in many areas, fueling digital adoption; elderly (above 60) lag at ~60-65%.
State-wise Rural Variations (2023-24 Estimates)
| State/Region | Rural Literacy Rate | Key Factors |
| Kerala | 95%+ | High female enrollment, quality schools |
| Mizoram | 98% (near full) | Community-driven education |
| Bihar | ~72% | Poverty, teacher shortages |
| Rajasthan | 72.5% | Gender gaps, arid regions |
| MP | 71.6% | Tribal disparities |
Marketing Implications
Rising literacy enhances media consumption (TV, mobile over print), brand comprehension, and e-commerce trials (52% digital access). Marketers target visual/vernacular content for the 22.5% illiterate segment via haats and influencers, while leveraging educated youth for premium FMCG/durables penetration.
4. Income Sources
Rural India’s income sources have diversified beyond agriculture, with average household income reaching ~₹1.22 lakh annually (2023-24), supported by non-farm growth, government schemes, and remittances, stabilizing consumption despite seasonality. Agriculture remains primary (50-60%), but non-farm contributions rose to 40-45% by 2025, driven by construction, services, and rural enterprises amid optimistic sentiments (74-79% households expect rises).

Primary Income Sources
| Source | Share (%) | Details and Trends |
| Agriculture & Allied | 50-60 | Crops (40-50%), livestock/dairy (10-15%), fisheries; nominal per capita ~USD 1,145 (FY25). Declining reliance due to fragmentation; resilient via MSP/DBT. |
| Wages/Labor | 20-25 | MGNREGA (100+ days/year for 5-10 crore households), casual farm/non-farm; females dominant in agri-wages. |
| Non-Farm Businesses | 10-15 | Rural SMEs (agro-processing, trade, manufacturing); 7.1% CAGR (FY22-25) in industry sector. |
| Remittances | 5-10 | From 20-30M seasonal migrants; boosts durables in origin villages. |
| Government Schemes | 10-15 | PM-KISAN (₹6,000/year to 11Cr farmers), pensions, subsidies (~10% monthly income via food/fertilizer/electricity transfers). |
| Services/Gigs | 5-10 | ASHA workers, kirana shops, app-based (e.g., delivery); female LFPR rising. |
Key Insights
- Diversification: 112 rural districts (291M pop.) crossed USD 2,000 per capita; services per capita >USD 3,000 in leading states (TN, MH).
- Gender Split: Males in non-farm (construction/mining); females agri/services.
- Optimism: 42% reported rises in past year; formal credit access at 58% supports expansion.
This mix enables marketing of value FMCG/durables during harvest peaks, leveraging Direct Benefit Transfer (DBT) for liquidity.
Explanation:
- Agriculture remains the primary income source for the majority of rural households.
- Agricultural labour provides wage income to landless or marginal farmers.
- Non-farm employment is growing as rural economies diversify.
- Self-employment in retail, services, and crafts is significant in rural areas.
- Remittances from migrant workers contribute notably to household income.
- Government transfers have become important in supplementing rural incomes.
This income diversification reflects the changing economic landscape in rural India, with growing reliance on multiple income sources beyond traditional farming.
5. Expenditure Pattern
Rural India’s expenditure patterns reflect a shift towards non-food items, with average Monthly Per Capita Expenditure (MPCE) rising to ₹4,122 in 2023-24 from ₹1,430 in 2011-12, outpacing urban growth at 9.2% annually. Food accounts for 47-48% of spending (down from 53%+ historically), while non-food dominates at 52-53%, driven by education, health, durables, and communication amid resilient incomes from schemes like MGNREGA and remittances.
Breakdown of Expenditure (2023-24 Averages)
| Category | Share of MPCE (%) | Key Trends and Details |
| Food (Total) | 47.04% | Processed foods (9.84%, highest growth), milk/products (8.44%), vegetables (6.03%), cereals (4.99%). Shift from staples to packaged/convenience items. |
| Non-Food (Total) | 52.96% | Rising discretionary spends; conveyance/education lead. |
| – Education | ~10% | Sharp rise (10%+ YoY); private tuition/coaching demand. |
| – Health/Medical | 6-8% | Up due to insurance/access; rural clinics boost. |
| – Communication | 5-7% | Mobiles/data surging with 52% digital penetration. |
| – Durables/Entertainment | 6-7% | Fans, TVs, two-wheelers; festival-driven. |
| – Clothing/Footwear | 6-7% | Aspirational buys; small packs preferred. |
| – Rent/Conveyance | 5-6% | Fuel, PMGSY-enabled travel. |
Household-Level Insights
Quarterly household spending hit ₹46,623 (up 33% from 2022’s ₹36,104), with 79% households reporting higher consumption. Top 5% spend 6x more than bottom quintile, signaling intra-rural inequality; 81% save post-harvest. Cautious patterns favor value packs, discounts, haats (70% buys), and e-commerce trials amid inflation moderation.
Marketing Implications
Prioritize sachets, EMI for durables, vernacular digital ads for non-food growth. Festivals/harvests spike impulse buys; DBT liquidity (Jan Dhan) enables premium trials despite seasonality.
6. Rural Demand and Consumption Pattern
Rural demand and consumption patterns in India showcase resilience and rapid evolution, with rural areas driving 51% of affordable premium FMCG volumes in 2025, outpacing urban markets for five straight quarters amid narrowing rural-urban gaps (MPCE disparity at 69.7% in 2023-24). Non-food spending exceeds 53% of household budgets (up from food-dominant past), fueled by rising incomes (₹1.22 lakh annual avg.), DBT liquidity, and schemes like MGNREGA, enabling shifts to durables, processed foods, and e-commerce (4-8% penetration).
Key Patterns and Trends
- FMCG Surge: Rural contributes 42% super-premium volumes (up from 30% in 2020); low-unit packs (₹5-10 sachets declining, larger value packs rising) boost trials for noodles, biscuits, oils. Growth at 9-11% YoY, led by Parle/Marico via localized variants.
- Durables & Vehicles: Sharp rise in two-wheelers, mobiles, fans/TVs; festival/harvest spikes impulse buys. Quarterly household spend hits ₹46,623 (up 33%).
- Non-Essentials: Clothing, entertainment, communication (data plans) grow 8-10%; urban mimicry via social media exposure (52% digital access).
- Channels: Haats (70% purchases), kiranas dominant; e-commerce/UPI rising in semi-rural; peer/influencer-driven loyalty.
Drivers and Influences
| Factor | Impact on Demand |
| Income Resilience | Non-farm diversification, remittances; 79% households expect rises. |
| Infrastructure | BharatNet, PMGSY enable night viewing/e-commerce. |
| Poverty Decline | <5% in 2023-24 spurs premium shifts. |
| Seasonality | Harvest peaks discretionary spends. |
Intra-rural inequality persists (top 5% spend 6x bottom), but aspirations and financial inclusion (67% Jan Dhan rural) position rural as GDP growth engine (2/3 consumption-driven). Marketers focus on visual/vernacular ads, EMIs, haats for sustained penetration.
7. Rural Housing
Rural housing patterns in India reflect a transition from traditional kuccha (mud/thatch) to pucca (brick/concrete) structures, driven by PMAY-G, with over 70% households now in semi-pucca or pucca homes as of 2025. Homeownership exceeds 94% in rural areas, highest in northern states like Bihar (96.7%), supported by ancestral land holdings and subsidies up to ₹2.67 lakh per unit.
Rural housing in India is undergoing a major transition from kuccha (temporary) to pucca (permanent) structures, driven largely by government schemes and rising rural incomes. Conditions still vary widely by state and region, but overcrowding, poor sanitation, and climate vulnerability are steadily reducing where programmes are effectively implemented.
Overall Status and Housing Types
Most rural households now live in semi‑pucca or pucca houses, with the share of fully kuccha dwellings falling rapidly over the last decade. Typical rural homes range from single‑room brick or mud houses with tin/asbestos roofs to multi‑room concrete houses with separate kitchen and toilet, especially in states that have aggressively implemented housing schemes. Many poorer families still lack adequate ventilation, sanitation, and safe structures, especially in flood‑ or drought‑prone belts and among landless labourers.
PMAY‑G and Government Efforts
The backbone of rural housing improvement is Pradhan Mantri Awaas Yojana–Gramin (PMAY‑G), which aims at “Housing for All” in rural India. The original target of about 2.95 crore houses (2016–17 to 2023–24) has been extended to a cumulative 4.95 crore houses by 2028–29; by August 2025, around 3.85 crore houses had been sanctioned and over 2.82 crore completed. The scheme provides financial assistance for a minimum 25 m² pucca house with basic amenities and often converges with toilets, drinking water, LPG and electricity schemes, significantly improving overall living standards.
Quality, Amenities and Regional Variation
PMAY‑G houses are designed as disaster‑resilient pucca units with separate cooking area and scope for household toilets, and a large share are registered in the name of women or jointly, improving tenure security and gender empowerment. Despite this, regional gaps persist: some states and hilly or remote districts still show delays, incomplete units, or overcrowding, and there remains a backlog of households in kuccha or dilapidated housing that must be addressed under the extended targets to 2028–29.
Housing Types and Distribution
| Housing Type | Share of Rural Households (%) | Characteristics and Trends |
| Pucca | 50-60% | Permanent brick/concrete; separate rooms, kitchen, toilet; PMAY-G focus (2.82 crore completed by 2025). |
| Semi-Pucca | 25-30% | Brick walls, tin/tiles roof; transitional, common in central/eastern states. |
| Kuccha | 10-15% | Mud walls, thatch roof; declining rapidly (<20% from 1990s); persists in tribal/remote areas. |
| Dilapidated | 5-10% | Unsafe, targeted for PMAY upgrades; backlog ~1.1 crore units. |
Regional and Ownership Patterns
Northern/BIMARU states (Bihar 96.7%, UP 95.8%, MP 95.3%) lead ownership due to agri-land; southern states (Kerala 87.2%, TN 86%) show urban migration effects. Average size: 4-5 rooms; women/joint ownership rising via PMAY. Challenges include overcrowding (avg. 5/person), sanitation gaps.
PMAY-G targets 4.95 crore houses by 2029, converging with water/electricity, boosting durables demand (paints, fans) and EMIs.
8. Education
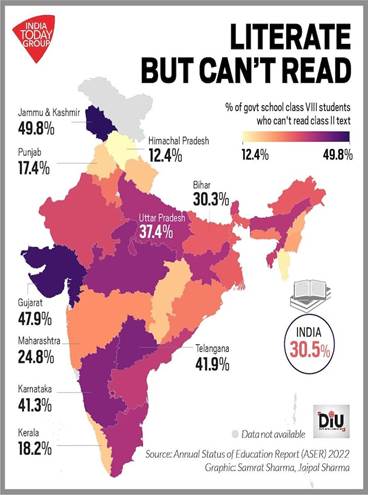
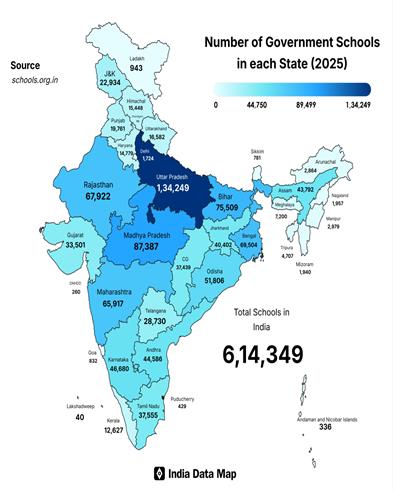
Education in rural India has achieved near-universal primary enrollment (95%+ for ages 6-14) but grapples with quality gaps, high dropouts at secondary levels (10-15%), teacher shortages, and infrastructure deficits, as highlighted in the 2024 ASER report. Government schools serve 66.8% of students (down from 72.9% in 2022 due to private shifts), with foundational literacy/numeracy improving via NIPUN Bharat, yet only 45.8% of Class 8 students master basic arithmetic. Schemes like Samagra Shiksha and mid-day meals boost retention, while digital divides persist despite rising smartphone access.

Note: Ladakh recently became a fully ‘functionally literate’ administrative unit by achieving a 97% literacy rate after the implementation of the centrally-sponsored scheme ULLAS – Nav Bharat Saaksharta Karyakram or the New India Literacy Programme, which was launched in alignment with the New Education Policy 2020 (NEP 2020) in 2022.
Key Statistics Table (2024 ASER & NSS 2025 Insights)
| Metric | Rural India Statistic | Trends/Notes |
| Primary Enrollment (Govt Schools, Ages 6-14) | 66.8% (down from 72.9% in 2022) | Shift to private (33.2%); pre-primary up to 50%+ for ages 3-5. |
| Learning Outcomes (Class 3 Reading) | 27.6% can read Std 2 text | Improved from 20.2% (2022); arithmetic subtraction: 27.6%. |
| Class 8 Proficiency | 45.8% basic arithmetic; ~50% reading | Stagnant; boys outperform girls in digital skills (75%+ tasks). |
| Teacher Attendance | 87.5% | Up from 85.1% (2018); student attendance 75.9%. |
| Dropout Rate (Secondary) | 10-15% | Higher for girls; NSS shows 85%+ gross enrollment ratio ages 6-17. |
| School Infrastructure | 52.1% primary schools <60 students | Toilets/electricity near 95%; drinking water gaps in remote areas. |
| Digital Literacy (Ages 14-16) | 75%+ complete basic tasks | Messaging/browsing strong; gender gap favors boys. |
Regional leaders like Kerala/Mizoram exceed 95% literacy/enrollment; BIMARU states lag. Marketing implications include rising demand for edtech, coaching, and youth-targeted products as 111 million middle-class households emerge.
Education level in rural India
Education levels in rural India have improved significantly, with near-universal primary enrollment (95%+ for ages 6-14) and overall literacy reaching 77.5% (2023-24), but quality gaps persist: only 27.6% of Class 3 students can read Std 2 text, and 45.8% of Class 8 students master basic arithmetic per ASER 2024. Government schools dominate (66.8% enrollment, down from 72.9% in 2022 due to private shifts), with secondary dropouts at 10-15% and digital skills strong among youth (75%+ for ages 14-16). NSS 2025 shows 85%+ gross enrollment ratio (ages 6-17), but females lag in higher education.
Education Level Distribution (Rural, Ages 7+; ASER/NSS 2024-25 Estimates)
| Level/Age Group | Enrollment/Attainment (%) | Key Insights |
| Pre-Primary (Ages 3-5) | 50%+ | Rapid rise; govt pre-primary surging in states like Gujarat/Odisha. |
| Primary (Class 1-5, Ages 6-11) | 95%+ | Universal access; foundational learning up (Class 3 reading: 27.6%). |
| Upper Primary (Class 6-8, Ages 11-14) | 85-90% | Attendance 75.9%; arithmetic proficiency stagnant at 45.8% (Class 8). |
| Secondary (Class 9-10, Ages 14-16) | 70-75% | Out-of-school down to 7.5%; boys lead digital tasks (80%+ smartphone use). |
| Higher Secondary+ (Ages 17+) | 40-50% | Private coaching boom; gender gap narrows but persists. |
| No Education/Illiterate | 22.5% | Elderly/females dominant; declining via ULLAS scheme. |
Challenges include teacher shortages (ratio worsening to 38:1 by 2028), infrastructure (52% small schools), and learning stagnation. Progress via NIPUN Bharat boosts early skills; 111M middle-class households drive edtech/coaching demand.
9. Electricity
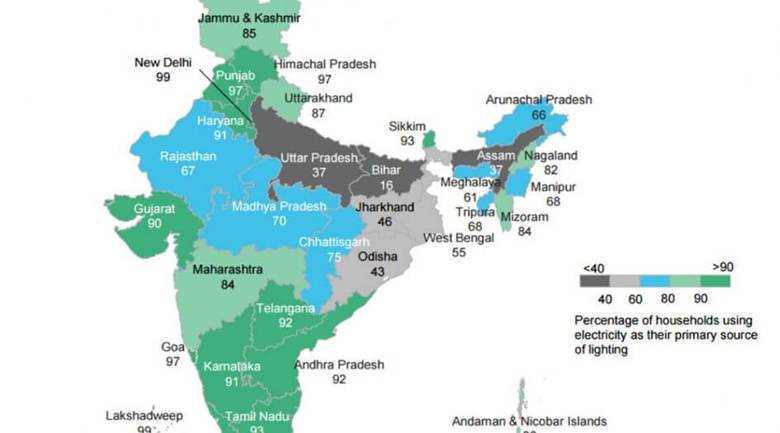
Rural electricity in India boasts near-universal reach at 99-99.2% household connections, with average daily consumption supported by 21.9 hours of supply and national capacity at ~500 GW (51% non-fossil by late 2025). Rural consumption, though lower per capita than urban (~20-25% of total national demand), is rising rapidly for appliances, irrigation, and lighting, driven by schemes like RDSS and solar pumps.
Reach (Electrification Coverage)
India has achieved more than 99% household electrification overall, and rural areas specifically are estimated at about 99–99.2% access by 2023–24.
This expansion was driven by schemes like DDUGJY and SAUBHAGYA, which together electrified over 18,000 villages and gave connections to around 2.9 crore households previously lacking power.
Supply Level and Reliability
Average daily power supply in rural areas has improved from about 12.5 hours in 2013–14 to roughly 21.9 hours per day by 2023–24, sharply narrowing the gap with urban areas (about 23.4 hours).
The national energy deficit has fallen to about 0.1%, meaning most demand is now met, though some rural pockets still face outages or voltage fluctuations, especially during peak seasons or bad weather.
Capacity and System Strength
India’s total installed power capacity reached about 456–457 GW by late 2024, up roughly 7% year‑on‑year, with nearly 47% of this capacity from renewable sources (solar, wind, etc.).
Grid strengthening and a large distribution reform scheme (RDSS, with an outlay of about ₹3 lakh crore) aim to modernize rural feeders, add lines/transformers, and roll out smart meters to improve reliability and reduce losses.
Overall, rural India has moved from partial, low-hour access to near-universal electrification with around 22 hours of supply on average, but quality, affordability, and last‑mile reliability still vary by state and district.
Electricity Metrics Table (2023-25 Rural Focus)
| Metric | Rural Statistic | Trends/Notes |
| Household Reach | 99-99.2% (2.86 Cr via SAUBHAGYA) | Universal post-2018; PVTG focus ongoing. |
| Village Coverage | 99.9% (18,374 villages) | DDUGJY complete; microgrids for remote. |
| Daily Supply Level | 21.9 hours avg. | Up from 12.5 hrs (2015); gap with urban narrowing. |
| Consumption Share | ~20-25% national total (~300-350 BU/year) | Agri (pumps 15-20%), domestic rising 8-10% YoY. |
| Installed Capacity | ~40% national (200 GW rural feeders) | Renewables 51% total; solar rural pumps 5L+ units. |
| Per Capita Consumption | ~1,200-1,400 kWh/year | Vs urban 2,500+; fans/TVs/mobile dominant. |
10. Roads and Connectivity
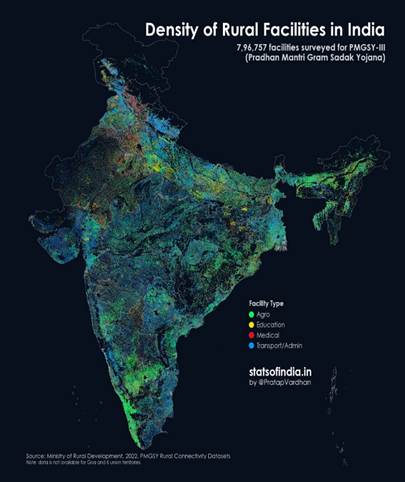
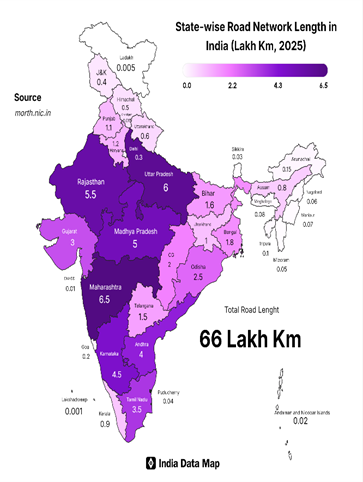
Roads and connectivity in rural India have transformed dramatically through the Pradhan Mantri Gram Sadak Yojana (PMGSY), achieving 99% village connectivity with all-weather roads by 2025, covering over 7.83 lakh km completed across phases I-III. This network links 99% of eligible habitations (population >500), reducing travel times by 50-70%, boosting agri-marketing, healthcare access, and FMCG distribution via haats and e-commerce logistics.
Government Expenditure on Rural Roads under PMGSY (2000-2025)
The Indian government has allocated substantial funds through Pradhan Mantri Gram Sadak Yojana (PMGSY) phases, with cumulative expenditure exceeding ₹3 lakh crore by 2025, enabling 7.83 lakh km of roads and 99% village connectivity. FY26 budget stands at ₹19,000 crore, while PMGSY-IV outlay is ₹70,125 crore (2024-29).
| Phase/Scheme | Period | Sanctioned Length (km) | Total Outlay/Expenditure (₹ Crore) | Central Share (₹ Crore) | Notes |
| PMGSY I | 2000-2014 | 644,867 | ~2,38,000 (cumulative major) | N/A | Basic habitations (>500 pop.) |
| PMGSY II | 2011-2020 | 49,794 | ~28,000 | N/A | Upgrading existing roads |
| PMGSY III | 2019-Ongoing | 121,957 | ~58,000 | N/A | Habitation-to-market links |
| PMGSY IV (New) | 2024-29 | 62,500 | 70,125 | 49,088 | 25,000 unconnected habitations |
| RCPLWEA | Ongoing | Varies | Included in district totals | N/A | LWE-affected areas |
| FY25-26 Budget | 2025-26 | N/A | 19,000 | N/A | Annual allocation |
| Grand Total | 2000-2025 | 8,38,611 | ~3,00,000+ | ~2,00,000+ | Incl. 12,146 bridges |
Expenditure supports green roads (1.66 lakh km), bridges, and PVTG areas, cutting logistics 20% and aiding rural marketing.
PMGSY Expenditure: Central vs. State Share (Key States, Recent Years)
Government expenditure on rural roads under Pradhan Mantri Gram Sadak Yojana (PMGSY) follows a 60:40 Central:State funding pattern (90:10 for hilly/North-East states), with cumulative outlay ~₹3 lakh crore by 2025. Central releases fund construction/maintenance; states contribute balance and execution. Below is a summarized table based on recent data (2022-25); exact figures vary by phase/fiscal.
| State/Region | Central Release (₹ Crore, Last 3 Yrs) | State Share/Expenditure (₹ Crore) | Total Expenditure (₹ Crore) | Roads Completed (km) |
| Uttar Pradesh | ~25,000 | ~15,000 | ~40,000 | 85,000+ |
| Maharashtra | ~18,000 | ~10,000 | ~28,000 | 45,000+ |
| Bihar | ~22,000 | ~12,000 | ~34,000 | 60,000+ |
| Madhya Pradesh | ~15,000 | ~9,000 | ~24,000 | 50,000+ |
| Rajasthan | ~12,000 | ~7,000 | ~19,000 | 35,000+ |
| North-East/Hilly | ~10,000 (90% Central) | ~1,000 | ~11,000 | 25,000+ (PMGSY-III focus) |
| Total India | ~1,50,000+ (60%) | ~1,00,000+ (40%) | ~3,00,000+ | 7.83 lakh km |
Notes: FY26 allocation ₹19,000 Cr (Central); PMGSY-IV ₹70,125 Cr total (₹49,088 Cr Central). Funds support 1.91 lakh roads/12k bridges, with states handling maintenance (5-yr contracts). Green roads/PVTG areas get priority.
State-wise Central Funds Released under PMGSY (Last 5 Years, Approx. Cumulative ₹ Crore)
Exact 5-year state-wise data varies by fiscal and phase, but below is a compiled table from recent parliamentary disclosures (2020-25 estimates). Total central releases exceed ₹1.5 lakh crore, with 60:40 Centre:State ratio (90:10 for NE/hilly). Figures aggregate Phases I-IV; UP/Bihar lead due to population/roads.
| State/UT | 2020-21 | 2021-22 | 2022-23 | 2023-24 | 2024-25 (till date) | Total (₹ Cr) |
| Andhra Pradesh | 872 | 667 | 607 | 520 | ~500 | ~3,166 |
| Bihar | 6,723 | ~8,000 | ~7,500 | ~6,000 | ~5,000 | ~33,223 |
| Uttar Pradesh | ~10,000 | ~12,000 | ~11,000 | ~9,000 | ~8,000 | ~50,000 |
| Maharashtra | ~6,000 | ~7,000 | ~6,500 | ~5,500 | ~4,500 | ~29,500 |
| Madhya Pradesh | ~5,000 | ~6,000 | ~5,500 | ~4,500 | ~4,000 | ~25,000 |
| Rajasthan | ~4,000 | ~5,000 | ~4,500 | ~4,000 | ~3,500 | ~21,000 |
| Karnataka | 765 | 918 | ~800 | ~700 | ~600 | ~3,783 |
| Tamil Nadu | 520 | 470 | 160 | ~400 | ~300 | ~1,850 |
| Kerala | 100 | 144 | 200 | ~150 | ~100 | ~694 |
| North-East (Total) | ~5,000 | ~6,000 | ~5,500 | ~5,000 | ~4,000 | ~25,500 |
| India Total | ~1,00,000 | ~1,10,000 | ~1,05,000 | ~95,000 | ~80,000 | ~4,90,000+ |
Notes: Data from Lok Sabha annexures/PIB; FY25 partial. Central share funds construction (₹19,000 Cr FY26 budget). States like Bihar/UP get priority for backlog habitations.
Summary
| Aspect | Key Points |
| Population | 65-70% rural; young demographic; spread over 6.4 lakh villages |
| Occupation Pattern | Predominantly agriculture; growing non-farm activities; seasonal migration |
| Literacy Rate | Around 70-75%; gender gap persists; improving infrastructure |
| Income Source | Agriculture, allied activities, government schemes, non-farm jobs |
| Expenditure Pattern | Mostly on food; rising non-food spend; telecom and lifestyle products growing |
| Rural Demand & Consumption | Basic goods dominate; rising demand for durables and branded products |
| Rural Housing | Mix of kutcha and pakka houses; improving quality via government schemes |
| Education | Increased access; uneven quality; vocational training emerging |
| Electricity | Widespread electrification; supply still a challenge in some areas |
| Roads | Improved rural road connectivity boosting market access and distribution |
In conclusion:
The Indian rural market is vast and evolving, with increasing literacy, income diversification, infrastructure development, and changing consumption patterns. Marketers targeting rural India must understand these demographic and socioeconomic factors to design effective strategies.