Rural consumer behavior refers to the buying patterns, preferences, and attitudes of people living in rural areas. It is influenced by unique characteristics of rural society, which differ significantly from urban markets.
2. Demographic Perspective
Features:
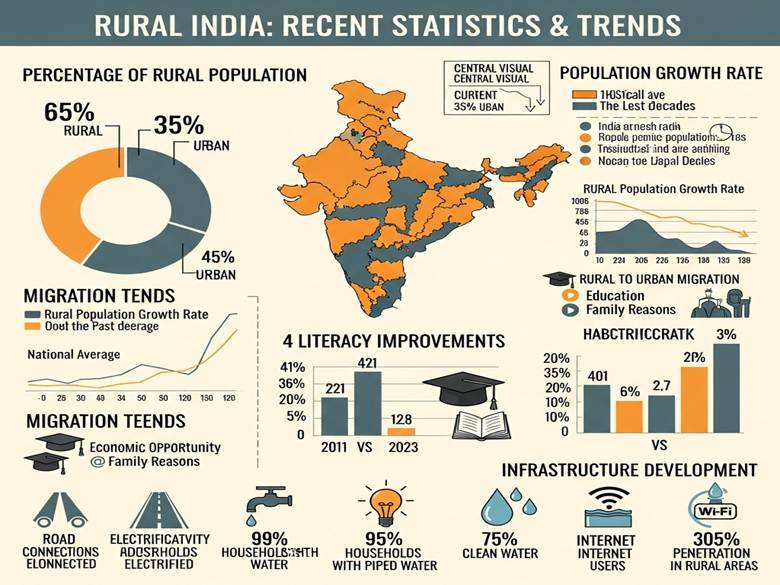
Population: Over 65% of India’s population lives in rural areas.
Age: Rural populations often have a higher proportion of young people and children.
Income: Generally lower and more seasonal (dependent on agriculture).
Education: Lower literacy rates than urban India, though improving.
Occupation: Dominated by agriculture, allied activities, and small businesses.
Example:
A rural family may delay purchasing a tractor until after the harvest season, when their income is highest.
3. Sociological Perspective
Features:
Community Orientation: Decisions are often influenced by family, neighbors, and village elders.
Role of Opinion Leaders: Sarpanch (village head), teachers, and successful farmers can shape opinions.
Joint Family System: Purchase decisions may be made collectively, not individually.
Gender Roles: Men often make major buying decisions, but women influence purchases related to food, clothing, and household needs.
Example:
A woman may influence the family’s choice of detergent or food brand, while men decide on agricultural equipment.
4. Cultural Perspective
Features:
Tradition & Customs: Festivals, rituals, and traditions strongly impact consumption (e.g., buying gold during Diwali).
Religion: Dietary choices, clothing, and celebrations are influenced by religious beliefs.
Language: Local languages and dialects significantly contribute to marketing communication.
Brand Loyalty: Once rural consumers establish trust in a brand, they tend to remain loyal.
Example:
During harvest festivals like Pongal or Baisakhi, sales of consumer durables (TVs, motorcycles) spike.
5. Lifestyle Perspective
Features:
Simple Living: Preferences for practical, durable, and value-for-money products.
Media Consumption: Rapidly increasing access to TV, mobile phones, and digital platforms, but word-of-mouth remains vital.
Limited Access: Fewer retail outlets; weekly markets (haats) are common shopping hubs.
Aspirations: Growing aspirations due to exposure to media and urban migration, yet strong ties to traditional values.
Example:
Haats are central to rural shopping; a local FMCG brand may distribute sample sachets at the weekly haat to boost awareness.
6. Case Studies
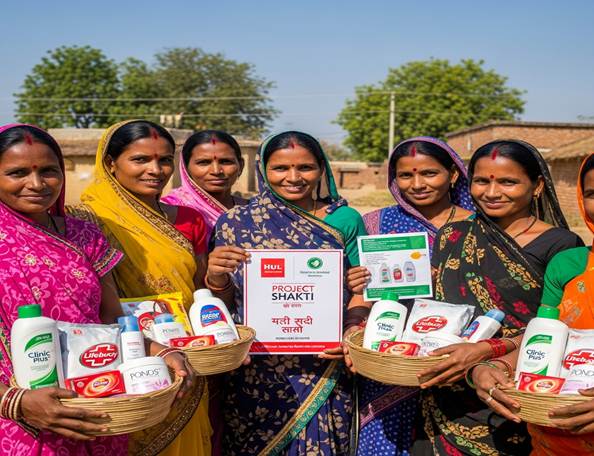
Case Study 1: HUL’s Project Shakti
Background: Hindustan Unilever Limited (HUL) trained rural women to become direct-to-home sales agents for FMCG products.
Demographic: Targeted women in villages with limited income opportunities.
Sociological: Leveraged community trust and women’s social networks.
Cultural: Women agents understood local customs and language.
Outcome: Increased brand reach and empowered rural women.
Here is an illustrative image representing HUL’s Project Shakti: It shows a group of rural Indian women dressed in traditional attire, smiling and standing together in a village setting. They are holding baskets and promotional materials featuring household products, symbolizing their role as Shakti entrepreneurs who distribute HUL products in rural areas. This image captures the essence of women’s empowerment and rural entrepreneurship that Project Shakti promotes.
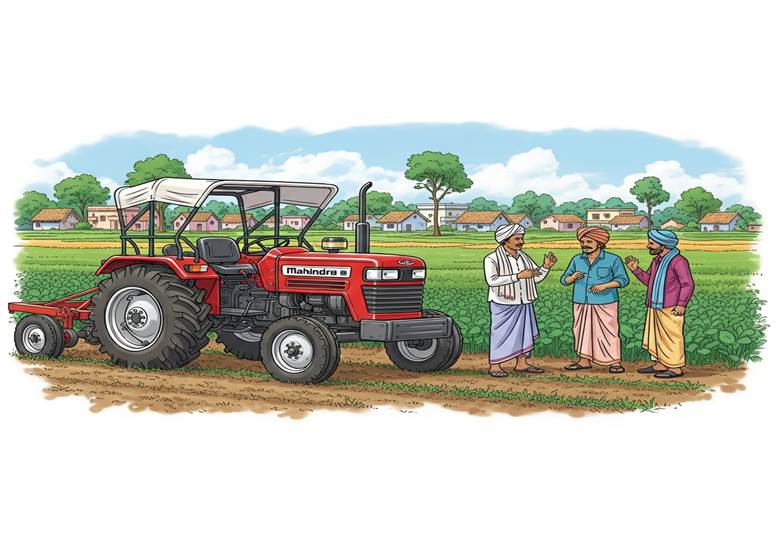
Case Study 2: Mahindra’s Tractor Sales
Background: Mahindra & Mahindra, a leading tractor manufacturer, customized its sales approach for rural markets.
Demographic: Focused on small and marginal farmers.
Sociological: Organized demonstration camps and involved local opinion leaders.
Cultural: Scheduled promotions around harvest festivals.
Lifestyle: Offered finance schemes to align with seasonal cash flows.
Here is a visual case study representation: Imagine a vibrant rural Indian landscape where farmers are actively using a red Mahindra tractor in lush green fields. The scene includes farmers in traditional attire working together and discussing it near the tractor, with rural homes in the background. This image highlights Mahindra’s strong presence and success in rural tractor sales, making it ideal for educational or marketing case studies focused on rural India.
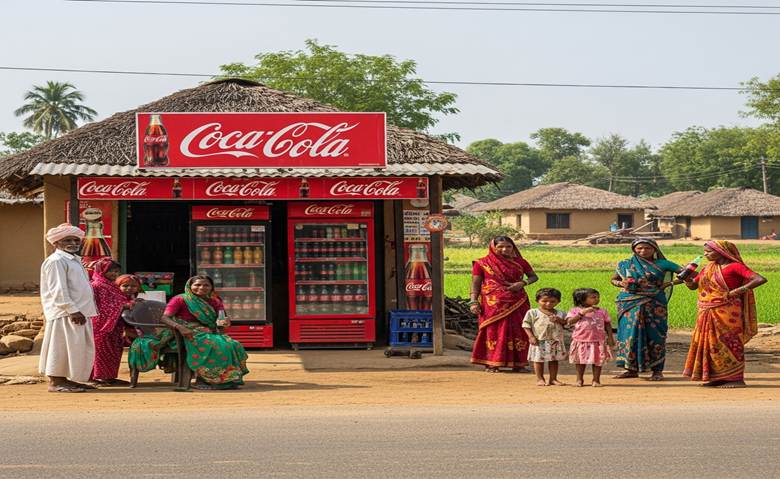
Case Study 3: Coca-Cola’s Rural Strategy
Background: Coca-Cola introduced smaller, affordable bottles and deepened its distribution in villages.
Demographic: Targeted lower-income groups with affordable pricing.
Sociological: Used local influencers and village retailers.
Cultural: Advertised using regional languages and festival themes.
Lifestyle: Sold products through local kirana stores and haats.
Sample Visual: Rural Lifestyle
Here is an illustration depicting Coca-Cola’s rural strategy: it shows a rural Indian village scene where a small local shop features Coca-Cola branding and refrigerators stocked with Coke bottles. Villagers, including women and children in traditional attire, are gathered around, some enjoying bottles of Coca-Cola. The background includes mud houses, a dusty road, and green fields, effectively representing how Coca-Cola has reached and integrated into rural markets.
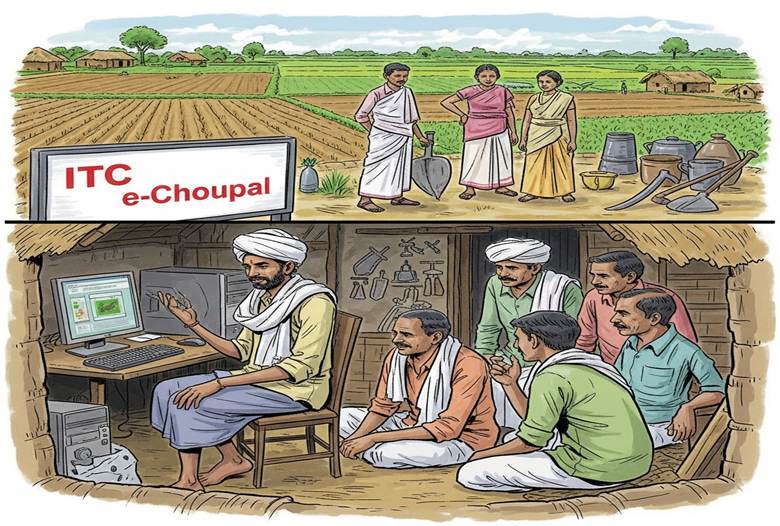
Case 4: ITC e-Choupal
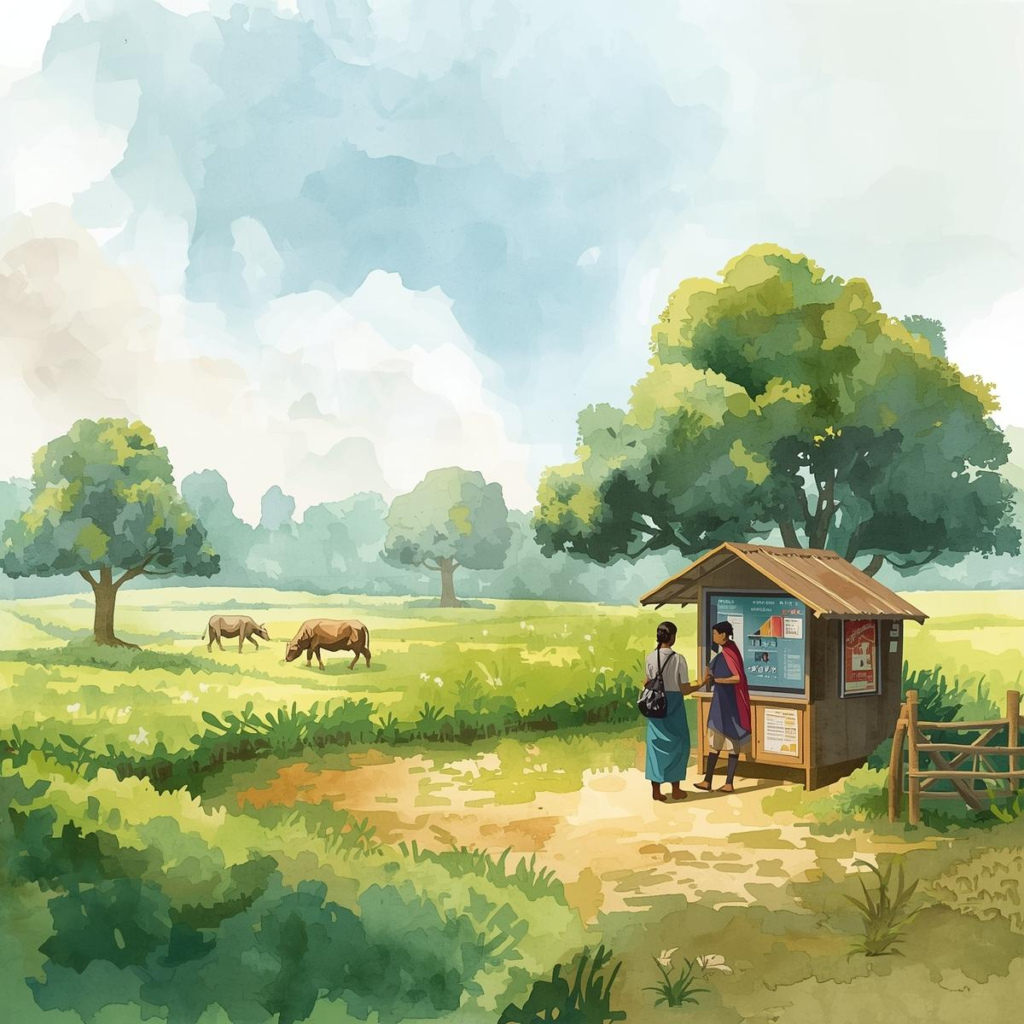
Description: ITC set up internet kiosks in villages to provide farmers with information on weather, prices, and best practices, changing how rural consumers access information and make decisions.
Here is an illustrative image representing the ITC e-Choupal case study: It shows a rural Indian farmer using a computer terminal inside a simple village setup, with an ITC e-Choupal signboard in the background. The screen displays agricultural information that other farmers gather around to discuss. The setting includes traditional elements like fields, agricultural tools, and villagers in typical rural attire, highlighting how technology is empowering farmers through ITC’s initiative.
Key Features of the e-Choupal Strategy
Aspect Details
Technology: Internet kiosks in villages, often managed by a trained local farmer (Sanchalak).
Information: Daily updates on market prices, weather forecasts, best farming practices, and news.
Disintermediation: Reduces the role of middlemen, allowing farmers to sell directly to ITC at better prices.
Community Focus: Centers serve as gathering points for education, healthcare awareness, and agricultural advice.
Empowerment: Sanchalaks (local coordinators) are trained and earn commission, driving local employment.
Implementation Steps
Identify Villages: Target areas with significant agricultural potential.
Set Up Kiosks: Equipped with computers, internet, and power backup.
Select & Train Sanchalaks: Educate local leaders to manage kiosks.
Build Trust: ITC focuses on transparency and farmer welfare.
Continuous Support: Regular training, technical support, and updates.
Conclusion
Understanding rural consumer behavior requires a nuanced approach considering the demographic, sociological, and cultural differences. Brands that recognize these unique characteristics and adapt their strategies accordingly—like Unilever, ITC, and Coca-Cola—have seen success in rural India.
Urban migration and schemes like MGNREGA boost disposable incomes, enabling premium buys during festivals. Aspirational shifts lead to two-wheelers over cycles in Punjab villages.
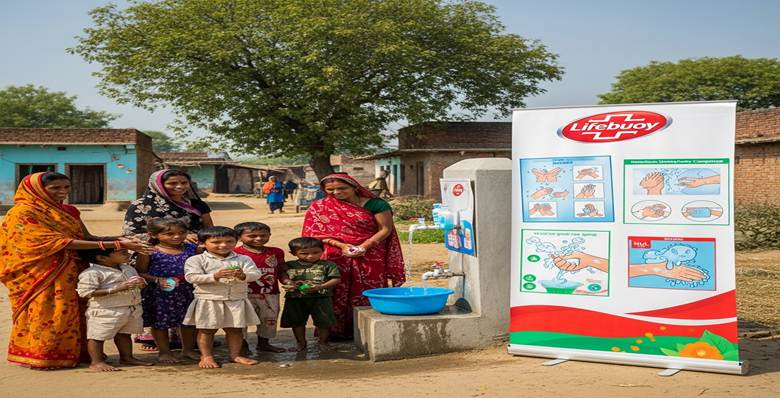
Example 1: HUL’s Lifebuoy campaigns modernized hygiene norms in Uttar Pradesh, increasing soap usage 3x through community demos aligned with evolving lifestyles.
Here is a visual representation of HUL’s Lifebuoy campaign modernizing hygiene norms in Uttar Pradesh: the image features rural children and mothers in traditional attire washing their hands with Lifebuoy soap at a community handwashing station. A colorful Lifebuoy campaign banner and educational posters about handwashing are visible, set against a backdrop of typical rural North Indian houses and trees. This scene highlights health awareness and community participation, reflecting how Lifebuoy has helped promote improved hygiene practices in the region.
How it affects rural consumer behavior:
Exposure to new products and brands: Rural consumers are increasingly exposed to urban lifestyles, global brands, and new products through television, the internet, and migrants returning from cities.
Changing aspirations: Modernization leads to changes in preferences, with rural consumers aspiring for better quality, branded goods, and modern amenities.
Shift in consumption patterns: Traditional preferences may give way to global trends, changing food habits, fashion, and entertainment choices.
Example 2: A rural family that previously wore only traditional clothing now desires branded T-shirts and jeans after seeing advertisements and relatives wearing them.
Case Study: Hindustan Unilever’s Project Shakti
Background: HUL launched Project Shakti to empower rural women as direct-to-consumer sales agents for its products.
Impact: Products like Lifebuoy soap, Fair & Lovely, and Wheel detergent reached remote villages. Through micro-entrepreneurship, rural consumers were exposed to modern hygiene and beauty products, altering their buying patterns and preferences.
Result: The project not only increased product accessibility but also modernized consumption habits in rural India.
2. Technological Factors
Smartphones (72% rural penetration) and UPI enable COD e-commerce, with 36% digital payments from villages. Jio’s affordable data spurred online research, doubling rural online buys from 4% to 8% (2015-2016).
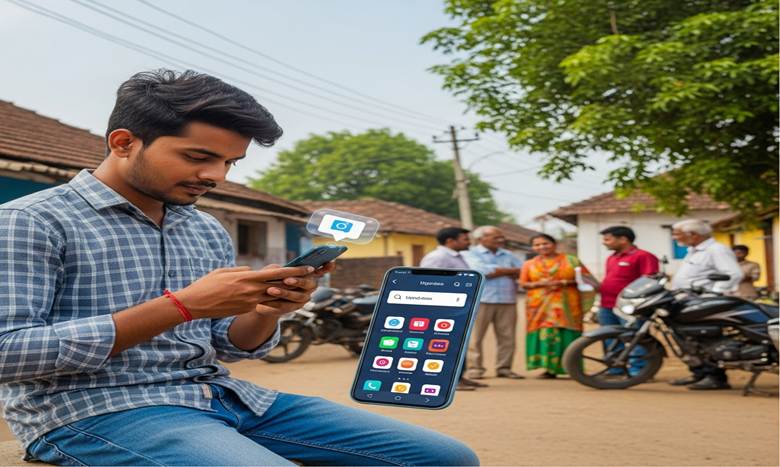
Example 1: BCG’s rural surveys across 14 states showed connected consumers like “Vikas” upgrading data packs, influencing 80% of purchases via apps in Maharashtra.
Here is a visual representation based on BCG’s rural surveys in Maharashtra: The image shows a young rural man, representing “Vikas,” using his smartphone in a village setting to upgrade his data pack through a mobile app. On his phone screen, icons of popular shopping apps are visible. In the background, other villagers are watching and discussing, illustrating how his actions influence their purchase decisions. The scene includes typical elements of a rural Maharashtra village, such as traditional houses, motorcycles, and lush greenery, highlighting digital adoption and peer influence among rural consumers.
How it affects rural consumer behavior:
Access to information: Mobile phones and the internet allow rural consumers to compare prices, learn about products, and access services previously unavailable.
Online transactions: Growth of digital payments and e-commerce introduces villagers to new ways of shopping.
Awareness and education: Technology spreads awareness about modern agricultural practices, healthcare, and financial products.
Example 2: A farmer uses a mobile app to check weather forecasts and compare crop prices in different markets before deciding when and where to sell his produce.
Case Study: ITC e-Choupal
Background: ITC set up e-Choupal digital kiosks in villages, giving farmers access to real-time information on crop prices, weather, and best farming practices.
Impact: Farmers became more informed, reduced their dependence on middlemen, and improved their income by selling their produce at better rates.
Result: This technological intervention transformed decision-making and purchasing behavior among rural farmers, making them more empowered and market-driven.
In summary:
Globalization/modernization brings new aspirations and products to rural consumers, changing what they buy and how they buy it (e.g., Project Shakti).
Technology empowers rural consumers with information and accessibility, enabling smarter choices and new consumption habits (e.g., ITC e-Choupal).
Channels of Distribution in Rural India Channels of distribution refer to the pathways through which goods and services flow from producers to consumers. Distribution channels in rural India cater to specific challenges like dispersed populations, inadequate infrastructure, and low literacy rates. Companies have developed innovative models to penetrate rural markets.
A. ITC (e-Choupal)
Description:
ITC e-Choupal is a digital platform that connects rural farmers directly with ITC, bypassing traditional middlemen. It provides real-time information on weather, prices, best farming practices, and market demand via internet kiosks installed in villages. Local farmers, trained as ‘Sanchalaks,’ operate these kiosks. Benefits:
Reduces information asymmetry. Farmers get better prices for their produce. ITC saves on procurement costs and ensures quality. Example: A soybean farmer in Madhya Pradesh checks e-Choupal for current market prices and weather updates before deciding the best time to harvest and sell his crop.
B. Godrej Adhaar Description:
Godrej Adhaar is a rural retail initiative that offers a one-stop shop for farmers, selling seeds, fertilizers, pesticides, animal feed, and even consumer goods. Stores also provide services like soil testing, veterinary advice, and farm equipment rentals. Benefits:
Increases rural access to quality products. Generates employment and entrepreneurial opportunities in rural areas. Example: A farmer visits a Godrej Adhaar store to buy certified seeds and receives free soil testing and crop advisory services.
C. HUL Shakti (Hindustan Unilever Limited)
Description:
Project Shakti empowers rural women by turning them into direct-to-home distributors of HUL products. HUL provides training and micro-credit support to women entrepreneurs, known as Shakti Ammas. Benefits:
Expands HUL’s rural reach cost-effectively. Promotes women’s empowerment and rural development. Example: A Shakti Amma sells soaps, shampoos, and detergents to 150 households in her village, earning extra income for her family.
D. Trade Management Description:
It involves the efficient management and organization of the supply chain, including logistics, inventory, distributor relationships, and retailer training. In rural areas, this means developing smaller SKUs (stock-keeping units), building last-mile connectivity, and educating retailers. Benefits:
Enhances product availability. Reduces stockouts and improves brand visibility. Example: FMCG companies appoint rural distributors and organize training programs for shopkeepers on product placement and customer service.
E. Rural Retailing Description:
Refers to organized retail formats specifically designed for rural consumers, such as rural malls, haats (weekly markets), and mobile vans. Retailers customize product assortments, pricing, and communication strategies. Benefits:
Brings urban retail experience to rural customers. Offers a wider range of products under one roof. Example: Hariyali Kisan Bazaar by DCM Shriram offers agricultural inputs, groceries, and household goods in a supermarket format in rural towns.
Case Study: ITC e-Choupal Background: ITC, a major Indian conglomerate, wanted to procure high-quality agricultural produce directly from farmers. The traditional mandi (market) system involved middlemen who often exploited both farmers and companies.
Solution: Launched in 2000, e-Choupal set up internet kiosks in villages, operated by local farmers. These kiosks provided:
Real-time market price updates Weather information Best agricultural practices Results: Over 4 million farmers across 40,000 villages benefited. Farmers’ incomes increased by 5–10% due to better price realization. ITC reduced procurement costs and built long-term farmer relationships. Exam Tip: Highlight how e-Choupal used technology to transform rural supply chains, improve transparency, and empower farmers.
Summary Table Channel Key Feature Benefit Example/Case Study ITC e-Choupal Digital farmer kiosks Direct market access, better prices A soybean farmer checks market prices Godrej Adhaar Rural retail stores Quality inputs and services, employment Farmer buys seeds & gets advice HUL Shakti Women micro-entrepreneurs, women empowerment, rural reach Shakti Amma distributes HUL products Trade Mgmt Efficient distribution Product availability, retailer support Rural retailer training Rural Retailing Rural malls, haats Urban retail experience, variety Hariyali Kisan Bazaar For exams:
Discuss the innovative approaches taken by companies to reach rural consumers. Use ITC e-Choupal as a detailed case study. Mention the social impact (empowerment, employment) in addition to business benefits.
A. Concepts and characteristics of the rural economy
Concept
Rural development is the process of making people’s lives better and their finances better, especially those who live in thinly populated or remote places. In the past, rural growth was based on misusing natural resources that needed a lot of land, like farming and forestry. But now, more and more people live in cities, and changes in global production networks have changed the way rural places work.
The progress of rural areas is still crucial to the growth of the whole country. More than two-thirds of the population in the country depend on farming for their livelihood, with one-third of rural India still living in poverty. Because of this, it is important for the government to work diligently and give them enough facilities to raise their level of living.
The actions that are taken to make rural areas better places to live and work to boost the economy are called rural development.
Characteristics of rural economy
The village is an institution: the village is the main institution in the rural community, and it meets almost all of their needs. People who live in rural areas feel like they belong and are united with each other.
Dependence on Agriculture: An important part of the country’s economy is nature and farming. In rural places, farming and related jobs are the main source of income.
Life in the Country: People who live in the country have basic lives. There are insufficient public services available, such as housing, schooling, health and sanitation, transportation and communication, banking, roads, and markets. Faith, traditions, and old ways of doing things are critical to people who live in rural areas. Most rural people have very low standards of life, which is sad. The rural sector lags significantly behind in terms of production methods, social organization, and political action. In the past few years, more people have been drinking booze.
Population Density: The number of people living in one square kilometer is very low, and houses are spread out all over the villages.
Employment Opportunities: In rural places, there is unemployment, seasonal unemployment, and underemployment. Individuals who are ready and able to work but cannot find work are said to be unemployed. Underemployment, which is also known as “disguised unemployment,” is when people are working more than they need to. When people work but production doesn’t go up, the condition is called “masquerading unemployment.” In rural places, both of these things constantly happen.
Poverty: People are poor when their basic needs aren’t met, like getting food, clothes, and a place to live. The figures for 2011–12 show that about 22 crores of people in rural areas are poor and live below the poverty line.
Debt: People in rural areas have a lot of debt because they are poor and don’t have enough jobs. This is because farm and non-farm jobs are scarce, the jobs pay little, and output is seasonal. In 1925, the famous British author Sir Malcolm Darling said, “An Indian farmer is born in debt, lives in debt, dies in debt, and leaves debt behind.” The villagers can’t get formal loans, so they have to rely on local moneylenders, who take advantage of them like parasites. As a result, many people in the village kill themselves.
Rural Income: People in rural areas earn little because the rural economy is too weak to provide jobs or self-employment opportunities. Many trained workers and laborers are underemployed, and there aren’t many ways for them to make more money.
Dependence: Most rural households rely on social grants and money sent back from family members who work in cities and towns.
Dualism: Two very different things existing together in the same place, such as developed and underdeveloped, organized and disorganized, traditional and modern, controlled and unregulated, poor and rich, skilled and unskilled, and other situations that seem to go against each other. People who live in country areas often have these traits.
Inequality: The distribution of income, wealth, and assets is uneven for individuals residing in rural areas. Numerous factors in history, society, and politics contribute to this imbalance. Landlords and owners control most of the operations in rural areas. A small group of people own land, animals, and other things.
Migration: People from rural areas have to leave their homes and move to cities in search of work to make a living. Cities are made possible by the way that growth works in this way. Bad relationships and a lack of basic amenities lead people to migrate from rural areas to cities. For Schumacher, this is like “double poisoning” because on one side, the farms are empty, and on the other, the towns are crowded. In his book “Small is Beautiful,” he discusses the problems with the way things are growing now.
B. Factors affecting rural economy
1. Rising level of knowledge
More reading and writing skills mean more job opportunities. According to the NSS, the literacy rate in rural areas in 2014 was 72.3% for men and 56.8% for women. This number is better than the rate in 2000, which was 68% for men and 43% for women.
Literacy rates are going up every year. Through SWAYAM and eVIDYA, the government has started to offer online classes. Through programs like Sarva Shiksha Abhiyan (SSA) and Rashtriya Madhyamik Shiksha Abhiyan (RMSA), the government has tried to get more people to go to school.
2. Work on infrastructure
For rural areas to grow, they need to have excellent infrastructure. Some of the most important signs of rural growth are roads, ways to communicate, electricity, clean water, irrigation systems, drainage lines, and decent places to live. In rural India, there have been more building projects and public service announcements in the past 20 years.
3. Adding new job opportunities
India’s rural areas have grown thanks to different policies, which have created new job possibilities. This kind of program is called TRYSEM (Training Rural Youth for Self-Employment). The main goal of this strategy was to teach young people technical skills.
The most recent example is the Atma Nirbhar Bharat Abhiyan, in which Hon. PM Modi asked companies to receive money to build prototypes. This will lead to more jobs over the next ten years.
4. The growth of mass media
People in rural areas are more aware now that there are more ways to communicate, like TV, social media, and radio. They can now seek employment, learn new skills, and talk to people outside the town thanks to cell phones and the internet.
Many people in rural places now know about government programs that can help them with farming and other activities. This is because of the growth of mass media.
5. Research in agriculture
The Indian Council of Agricultural Studies (ICAR) is in charge of agricultural studies in India. Research helps us figure out how food yield changes when the weather and soil are different, as well as how using certain fertilizers can boost production. Farmers have been helped by the use of new scientific tools. The green revolution came about because of this.
6. The effect of cities
Social media and other forms of communication have brought people from rural areas closer to people from cities. People in cities have an effect on people in the country. It changed how they lived and what they bought, which made more people want to buy consumer things.
Many industries and MNCs joined the rural market because of higher demand. MNCs worked to deliver their products to people at prices they could pay. More purchases contributed to the market’s growth. MNCs also started hiring locals, which raised the rate of employment.
7. Initiatives by the government
India’s government has done a lot to help rural areas grow and improve. Here are a few examples:
For self-sufficiency, Operation Flood and the White and Blue Revolution
The Integrated Rural Development Program (IRDP)
REP—Rural electrification program for providing an electricity supply
PSU and Banks lending money to farmers
Banks and the PSU Getting farmers loans
8. Contract farming
Contract farming is when businesses give farmers high-yield seeds and expect them to grow crops and send them back to the business. In this way, farmers don’t have to use their money to grow.
C. Basics needs of rural economy
Rural development is crucial for the comprehensive growth and advancement of the Indian economy for the following reasons.
A significant portion of the population resides in rural areas, and their growth and contributions play a crucial role in supporting the nation-building efforts. India cannot achieve development by keeping rural areas underdeveloped.
The rural economy aids the urban sectors by providing essential resources such as drinking water, milk, food, and raw materials. The underdevelopment of the rural sector will significantly hinder the overall economic advancement.
Enhancements in education, health, and sanitation in rural areas can prevent certain urban issues such as begging, scavenging, and the formation of roadside slums.
Agriculture and related activities are essential for creating employment opportunities in rural regions and enhancing total food output.
Developing rural areas can help decrease the negative effects of brain drain and rural-urban migration.
Developing the rural economy is necessary to make better use of underused and underutilized resources.
Rural development should reduce the disparity in infrastructure provision between rural and urban areas.
To enhance the country’s position in the global sphere regarding economic metrics such as the Human Development Index (HDI), Women Empowerment Index (WEI), Gender Disparity Index (GDI), Physical Quality of Life Index (PQLI), and Gross National Happiness Index (GNHI), these factors should be prioritized.
D. Rural-Urban disparities and Policy interventions.
Introduction
Rural development requirements differ from urban development demands and vary across different geographic locations and regions. Rural development in India largely focuses on the development of resources necessary for daily activities in a large and divided country. The main reason for a limited sectoral approach to rural development is the illogical placement of manufacturing facilities, inadequate infrastructure, and various other issues. The focus is on electrification, jobs, basic healthcare, and water management. Development work is carried out for a specific group or area within a cluster using a cluster management approach.
Urban development involves improving systems, traffic management, transportation, infrastructure, building management, and institutional management. The attitude, literacy, desire to adapt, and flexibility of target audiences vary in each scenario. Rural and urban development are interdependent for achieving comprehensive economic growth.
Should India change its focus?
Mahatma Gandhi’s statement, “India lives in its villages,” remains accurate in the present day. Rural communities have not benefited from development despite rising urbanization. These regions continue to experience challenges such as malnutrition, lack of education, joblessness, and inadequate infrastructure, including schools, universities, hospitals, and sanitary facilities.
The significant difference in living standards clearly indicates the contrasting aspects of India, which is a rapidly rising economy and one of the largest in the world. Rural Indian communities must develop concurrently with metropolitan regions, and the quality of life there must be enhanced for inclusive growth to take place.
The following are some disparities between rural and urban regions:
1. Disparities in Education
Urban areas undoubtedly boast superior infrastructure and educational systems compared to their rural counterparts. At both the elementary and secondary school levels, educational institutions in urban areas are extremely advanced, and the urban area education system is designed to provide students with a more enjoyable learning environment.
Conversely, in rural regions, students are deprived of even the most fundamental services and infrastructure; private schools and colleges are nonexistent, and teachers in government schools rarely attend classes. Only in such circumstances do students have the opportunity to receive an appropriate education.
2. Urban versus Rural Health Disparities
This section will cover healthcare disparities. Overall, urban health and medical systems are superior to their rural counterparts. The health sector in urban areas is more advanced and developed than that in rural areas.
In the rural healthcare sector, there is a dearth of appropriate medical equipment, inadequate infrastructure, and the majority of practitioners engage in fraudulent practices. This is the rationale behind the preference of individuals residing in rural regions to seek medical services in urban areas. The Indian government has been diligently operating in an effort to reduce the disparity between urban and rural health.
3. Employment Opportunity Disparities
In this regard, the contrast between urban and rural areas is likely the most pronounced. The rural populace relies heavily on agriculture for sustenance. Additionally, approximately sixty percent of the nation’s populace is involved in agricultural pursuits. Work restraint in the secondary and tertiary sectors or in the non-agricultural sector.
Certainly, those with an interest in pursuing careers in the tertiary or secondary sectors will find more favorable opportunities in urban settings. Over the past few years, rural areas have witnessed the emergence of several employment opportunities beyond farming. These include working in the marketplace, mining, teaching, small-scale industries, and more.
4. Architectural Disparities
In rural regions, the majority of inhabitants inhabit modest dwellings constructed from mud, thatched roofs, and huts; these structures are typically uncomplicated and impermanent, rendering them susceptible to damage from natural calamities such as heavy rainfall, floods, or tsunamis.
Conversely, an urban region predominantly comprises expansive apartments, while houses in this sector are built utilizing cement, cutting-edge technologies, and contemporary machinery, none of which are susceptible to damage.
5. Lifestyle Disparities
The rural populace generally leads a very uncomplicated way of life. Due to the prevalence of day-to-day employment in the agriculture or dairy industries, rural residents typically lack access to electricity in their dwellings and rely on ovens to prepare their meals. The lifestyle in urban areas is characterized by greater development and improvement.
Individuals in urban areas earn higher wages as a result of increased employment opportunities, which in turn raises the demand for shopping, food, and new digital technologies. Consequently, novel products and services are imported from other nations, and new categories of items have emerged in urban areas, all of which contribute to the enhancement of the lifestyle of urbanites.
E. Role of Agriculture in the Economic Development of India.
Agriculture’s significance in India’s economic development cannot be ignored, despite the crucial role performed by industries. This section will outline the seven crucial roles of agriculture in economic development.
1. Meets the growing food demands of the nation
Agriculture in India plays a crucial part in providing food. Agriculture meets the increasing food demands of the growing population. Food production is rapidly expanding, putting a heavy burden on surplus labor markets like India. If agriculture cannot continually increase its surplus of food grains, a catastrophe is likely to happen. Several developing countries are currently experiencing this phase, and agricultural practices will be enhanced to fulfill the increasing food requirements.
2. Distribution of raw materials to agricultural-based industries
Agriculture supplies raw materials to many agro-based industries like sugar, cotton textiles, jute, and vanaspati. Agriculture is crucial to the food processing business. The expansion of these industries is crucial for agriculture and farmers.
3. Improving Rural Quality of Life
Greater agricultural surpluses resulting from higher agricultural production have a positive impact on society welfare, particularly in rural areas.
4. Facilitates capital accumulation
There is a general agreement on the necessity of capital formation. Agriculture plays a crucial role in the economic growth of emerging countries like India by speeding capital formation due to its significance as the primary industry. If it does not comply, the entire economic growth process will face a setback.
5. Industrial Product Market
Rural purchasing power expansion is essential for industrial development, as villages are home to two-thirds of the Indian population. Big farmers had an increase in spending power due to their higher revenues and minimal tax obligations following the green revolution.
6. Contributes to the national Gross Domestic Product (GDP)
Agriculture has always played a vital part in contributing to India’s national GDP. In 1950-51, agriculture and related sectors contributed around 59% to the total national income. Although the share of agriculture has decreased steadily due to the growth of other industries, it remains comparatively high compared to industrialized nations worldwide.
7. Infrastructure Development
Agriculture’s involvement in economic development requires the establishment of infrastructure such as roads, postal services, marketplaces, warehouses, shipping facilities, and other components to facilitate the rise of industries and the commercial sector.
In India, it is especially important to make sure that data collection and study methods can be used by people who speak different languages, have different levels of literacy, and have varying levels of access to or familiarity with the internet.
Research on the rural market has existed for much longer and followed a defined structure even before urban markets fully developed. It’s funny, but this is true: most studies that have looked into health, learning, family planning, or building projects always start in the suburbs or the country.
However, research on marketing and its associated issues has only recently begun. This is because companies like HLL, Dabur, Colgate Palmolive, and Richardson Hindustan Ltd. (now P&G) started to do business in rural areas and found that they didn’t know much or anything about those markets. There was information about socioeconomic groups, like occupation profiles, school profiles, or ownership profiles. But there was no information about income, how it was spent, or what people liked to buy. Therefore, it became hard to divide the markets into different groups. Most businesses that wanted to get into rural areas either used published sources or paid for their studies.
A. Steps in rural marketing research
Understanding the applicable marketing strategy requires the development of a research plan.
The eight stages below assist in developing a plan for rural research:
1. Establish the Research Problem and Goals
The problem description phase specifies the subject matter to be examined. It is possible for the objectives of research to include the investigation of rural markets, distribution methods, or consumer behavior in rural areas. We will utilize different approaches to data collection for each of these aims. At this stage, the company must establish a clear understanding of the research and the intended outcomes.
2. Create a customized research plan for each district.
Given the diversity of rural consumers, it is crucial to customize a research strategy for each district. The organization is responsible for determining the essence of the research that will be carried out, coming up with the essential research questions and the recipients who are most suitable for them, and coming up with methods for data analysis.
This phase involves the formulation of hypotheses that can be tested, the specification of the processes for selecting a representative sample, and the establishment of the methodology for collecting the sample data. Qualitative research typically takes place in villages due to the limited number of participants.
3. Conduct a Secondary Data Search
Secondary data comprises publicly available information from government agencies, including but not limited to census, transportation, school, and public health data. Although secondary data on rural areas is limited in scope, researchers have the option to access industry associations, consultancies, and rural journals, as well as trade associations such as the Federation of Indian Chambers of Commerce & Industry (FICCI) and the Confederation of Indian Industry (CII).
Professional research firms such as Nielsen, Accenture, McKinsey, Ernst and Young, and the Indian Market Research Bureau (IMRB) publish reports and conduct research on rural markets. However, it is important to note that these secondary data sources, along with others, provide a macro perspective of villages.
4. Construct a main research investigation
Primary research is frequently required when secondary data from rural areas is inadequate. It is determined whether primary data will be gathered through a survey, interview, observation, or online source. In addition to formulating and translating questionnaires into local languages, the methodology for conducting a primary study is also delineated.
5. Sample Selection
When selecting samples, it is essential to maintain objectivity and ensure that they are adequately representative of the overall population. Because of this, cluster or stratified sampling is necessary in order to include all of the socioeconomic groups that are present in a community.
This method is frequently not possible in rural locations, although metropolitan areas have a tendency to favor conducting random sampling. When doing sampling in rural areas, it is vital to use convenience sampling. Only the researcher can ensure comprehensive coverage of all socioeconomic, caste, and religious categories to the maximum extent possible.
6. Gather Primary Source Data
Field workers face a significant obstacle in primary data collection: not only must they travel great distances, but rural residents are also wary of urban individuals carrying questionnaires. It is nearly impossible to conduct one-on-one interviews because villagers typically congregate around the researcher. For researchers to converse with women, females are required. People are also unfamiliar with brands, which further complicates comparisons.
Respondents frequently provide responses that align with perceived expectations rather than reflecting their true emotions, posing an additional challenge for the researcher. To conduct interviews, participants are questioned in small groups. However, the researcher must be able to conduct interviews with villagers in their native tongues while simultaneously providing explanations and gathering information. Occasionally, casual observation of markets and consumers can yield valuable insights into rural existence without the need for formal inquiries.
7. Data Analysis
Statistical tests are utilized to assess the validity and reliability of data. Nevertheless, statistical techniques such as factor analysis, correlation, regression, and discriminant analysis are only applicable when the data set is substantial in size. However, such an outcome is improbable to occur in rural areas. Cluster analysis, which identifies elements’ commonalities, could be one method utilized in rural market research. It would be a significant undertaking to eliminate researcher bias in qualitative research.
8. Apply the findings to guide marketing decisions.
In the last stage, meaning is derived from the analysis of the data, and recommendations for the marketing plan are formulated in a realistic manner.
B. Sampling Methods
You need sampling because you can’t talk to or question every customer or non-customer. Sampling aims to find what works for a small group so it can be used for the whole community. Sampling means picking a small group of people from the whole community to talk to. There are two main requirements for the sample: it must be fair and true to the whole community.
In an ideal scenario, each member of the population should have an equal chance of selection from the group. At the same time, this is not possible in rural places. Generally, we exclude certain groups of people, such as women and members of specific castes. So, methods that aren’t based on chance are used, and easier sampling is often used. In towns, it is important for probability methods to use stratified sampling so that the person answering the survey picks people from each group. If groups are easy to spot, cluster sampling could also be used.
Here’s how to understand these:
1. Stratified sampling
Stratification is the process of dividing people in a town into smaller groups that are similar to each other. Then, within each subgroup, either simple random selection or systematic sampling is used. One way for a researcher to find out how people in the whole community behave as consumers is to pick a sample from each of the three social classes: the upper, the middle, and the lower.
2. Cluster sampling
The whole population is split into groups, and then random samples are chosen from each group. For instance, we could divide the people in a town into groups based on their jobs and then pick people at random from each group.
When experts choose samples based on their own opinions, the process is called non-probability sampling. It’s often done because of real concerns, like not having enough time or resources to carry out full-fledged surveys. Researchers must use easily accessible groups to survey villages.
In non-probability sampling, there are three popular ways to do things:
a. Convenience sampling
Convenience sampling is a type of non-probability sampling in which people are chosen as subjects because they are easy to reach. In villages, it means talking to people who are there at a certain time. Even though it’s quick, the method might not work well.
b. Quota sampling
In quota sampling, the population is split into subgroups that can’t be joined together. Then, things are chosen from each subgroup based on a certain percentage. A company may set a goal to interview 30 people in each village.
c. Judgemental sampling
Judgment sampling is when a researcher picks things from a community based on his or her opinion. For example, a researcher might choose to talk to the sarpanch or other important people in a village or ask them for recommendations to get good answers. This type of study is known as judgmental sampling.
C. Rural Market Research
It’s not easy or a set of steps to do rural market research because customers live far away and don’t always see brands and goods. There is a lack of secondary data on how people in villages buy things.
Because of this, traditional ways of doing market research don’t work well in rural places. Many companies have wasted a lot of time and money trying to build supply chains to rural areas because they don’t have correct information about what people in villages buy. Most businesses only need to look at the population data—about 850 million people who aren’t getting enough service—to see what a significant chance it is. But marketing in rural areas will fail if people don’t know the people who live there and what they buy.
Researching what customers want helps with every part of marketing strategy. You need it to answer questions and help with your marketing plan.
It helps businesses do the following:
1. Identify potential customers and segments
A big part of rural market research is finding buyers in rural areas and wealthy groups within the rural population. To achieve this, you need to collect detailed info.
2. Getting People to Use Products
Why do people buy certain things? That’s an important question to answer. For instance, people may purchase a washing machine in cities to wash clothes, but in rural areas, they may use it to make milk. These kinds of insights can help businesses change their goods.
3. Know your current customers.
People who buy things from companies need to know what those people value and why they buy. They can find out who makes people buy things and what role models are popular in rural areas. Also, businesses find out which items people buy because they work and which ones they buy because they look appealing.
4. Figuring out buying habits
Some of the most important factors are where people like to buy things, how much they buy, and when they buy it. As a result, special channels of distribution are set up to serve rural areas. A village store sells some things, but a close town has other things that can be bought.
5. Make a plan for marketing
Market research helps with decisions like how to create, price, package, distribute, and communicate about a product. Research also tells businesses about their rivals, which helps them come up with counteroffers.
D. Key challenges in Research data collection.
India has many different cultures and landscapes, which makes it hard for marketers and researchers to make surveys for rural India. Here are some of the most significant problems they face:
1. Reach: The 2011 Census found that about 58% of India’s rural population lives in 115,080 villages with 2,000 or more people. In practice, this means that about 80% of all towns in India are small or minimal, with less than 2000 people living there. FMCG companies face a big problem when they try to reach end customers in rural areas, which is called the “last mile.” Also, companies have a challenging time getting their products to the 33 million stores in rural India because it costs a lot to deliver them. To reach into rural areas, it’s important to have a focused and targeted reach. This important factor needs to be taken into account when planning the survey’s scope of study and sampling method.
2. The business can make money: In India, 85,000 large villages are home to about 40% of the people and 60% of all processed food and beverages. For business reasons, it’s not possible to cover all of rural India because the population and buying power aren’t evenly distributed.
3. High level of heterogeneity: “One size fits all” doesn’t work well when making a survey or plan for India’s rural areas. For instance, more than 75–80% of the people who live in poor and backward states like Bihar, Uttar Pradesh, West Bengal, and Madhya Pradesh live in rural areas. On the other hand, the spread of people living in urbanized states like Tamil Nadu, Maharashtra, and Telangana is more fair. Because of this, every state has its own unique demographic and sociocultural profile, which should be taken into account when planning the sampling method for any primary research study.
4. Gender Equality: In rural India, women are important buyers and makers of many product categories, but men are more likely to be the main buyers. “Whom to interview” is therefore one of the most important questions to answer when making a poll.
5. Many different languages: India has 22 legal languages and a lot of different local languages, dialects, and everyday words. Therefore, being able to communicate well in more than one language is necessary for running surveys in rural India.
E. Methodologies for rural research
Developing a method that accurately captures the diversity of rural India requires consideration of the following factors:
1. Regional representation
In India, which is very big and has many different kinds of people, it is important to reflect heterogeneity and make sure that the study is representative. For example, Northerners and Southerners have very different views and behaviors. In the same way, people from other places have different social and cultural backgrounds that often affect how they think and feel, especially about touchy topics.
So, choosing Socio-Cultural Regions, or SCRs, is often the first step in figuring out how people in rural areas buy things. The regions help us understand people and their actions by putting them in the context of common farming practices, social and cultural differences, and income and spending habits that depend on the crop season.
2. Adequacy of sample
India’s different states have very different amounts of people living in them. For instance, Uttar Pradesh, India’s most populous state, is home to almost 15% of the country’s people. On the other hand, less than 0.5% of India’s people live in the tiny state of Goa. So, in a pan-Indian or multi-state survey, it is important to divide the group by state. Most of the time, states are divided into groups based on their population, such as high-population states, middle-population states, and low-population states. The sample is then set for each band based on the size of that band’s population to make sure it is a good representation of the whole.
The sample size would also rely on things like how detailed the data needed within a state is and how different the population characteristics are within a state (et al.).
3. Defining rural
According to the Indian Census, a rural village is a place that meets all three of the following criteria:
There are less than 5,000 people living there.
75% of the men work in non-agricultural jobs.
There are also less than 400 people living in every square kilometer.
However, this huge and very large area covering is hard for any marketing company to cover for business reasons. Because of this, different meanings of “rural” are used to make things more practical. Many businesses use the “hub and spoke model” to show how their distribution routes connect with rural areas. They look at areas that are close to or within a certain distance of the feeder towns.
Most businesses in rural India have trouble with the last mile of connection. It’s not seen as a good idea to cover the center or remote parts of rural areas. The “immediate” possibility for targeting rural India is in the villages on the edges of small towns or feeder towns that are easy to get to. The “Ringing Method” is another name for this way of choosing your village.
The things listed above have big effects on how researchers come up with a good method and, even more importantly, how they choose a good sampling method for their study.
4. Other Imperatives
When planning methods for rural study, there are a few other things that you need to keep in mind:
Permissions: Before doing any fieldwork in a village, it is important to talk to the village leader, who is called the “Sarpanch,” about the study and its goals and get permission to do fieldwork. This is official proof from the head of the village that they know about the study and give their official permission.
Village Map: Before you start fieldwork, you have to make a rough map of the village to get a sense of its plan and the most important buildings, such as the hospital, school, panchayat office, temple, or any other place of worship. The team leader usually does this activity with the help of an older person from the town, like the sarpanch, schoolteacher, or someone else. Rural homes and households in a village are not organized or follow a plan like homes in cities. Maps also help choose and sample clusters of homes and households in that village.
Using slang: Because Indian states have a lot of different languages, certain sentences or words have different slang meanings. So, to make it easier for people to understand the questions, it is usually suggested that the local language be added to the instrument based on comments from a knowledgeable person in the area, like a schoolteacher.
Multinational companies and marketers are now focusing on people in rural areas. This means that spending on rural market research in India is expected to rise soon. It looks like this is a good chance for market research firms to improve the way they do research with country customers in mind. At the same time, researchers should keep in mind some of the problems that come with doing research in rural areas, such as a community that isn’t very tech-savvy, doesn’t read or write well, or isn’t well connected, when planning how to do research with this group.
A few of this year’s most intriguing and important trends in rural commerce are as follows:
1. Large population
There is a huge opportunity for marketers in India’s rural market due to its size and demand. There are over 630,000 villages and 450 districts that make up our nationality. With 833 million people calling rural India home as of the 2011 Census—a figure that includes 33 percent of the country’s youth—and a rise in the total number of households from 25.33 crore to 833 million, the rural market in India is massive. Currently, the fast-moving consumer goods industry in rural areas values consumer expenditure at around $10 billion USD each year. Food categories are currently the most important among the additional USD 90 billion expected to enter the market by 2025.
2. The expansion of service sectors
At about 54% of GDP, the service sector dominates when looking at the economy as a whole. Rural India has observed similar tendencies, with the service sector steadily growing as a viable substitute for agricultural and related pursuits. In a pandemic-induced economy, while other regions and industries witnessed enormous unemployment, the rural service sector added nearly eight million jobs. Rural commercialization is on the rise as more and more people in rural regions become comfortable with technology and use it to sell goods and services online. The widespread availability of cellphones and affordable, high-speed internet in rural areas of the country could be a contributing factor. The result is a steadily expanding service sector in the area.
3. An increase in picky shoppers
Shoppers in more remote places should brace themselves for a meteoric rise in demand. The widespread availability of the internet and social media has broken down geographical barriers, linking hitherto isolated rural communities to global communities. Through social media, they may satisfy their urge to know what’s happening in the world and what’s trendy. But now, with a single click in their favorite language, consumers may order anything, driving up the e-commerce consumer rate. As neighborhood stores become last-mile service providers, there will likely be a steady increase in the total coverage of eCommerce enterprises.
4. An expanding rural market is a direct outcome of the rising purchasing power of rural Indians.
Due to an increase in purchasing power among rural residents, the rural market in India has been increasingly important in recent decades. As a result of technological advancements, more and more people are acquiring manual skills, which is excellent news for the local handicraft industry and the economy as a whole. The use of e-commerce by rural residents to sell their wares to buyers in cities and around the world also helps broaden the rural market.
5. Rising literacy rates in remote areas
To reach the goals for rural trade, it is essential that rural literacy rates continue to rise. The more people rely on the internet for their day-to-day activities, the more they will want to understand how to make the most of it. Online education is another service offered by e-commerce sites, bringing educational opportunities to individuals of all ages. They will be able to study online with devices they bought from e-commerce websites, so they won’t even have to leave the rural area.
The gradual spread of educational technology into rural areas of the nation also reveals this pattern. Literacy rates in rural areas are on the rise, having recently reached close to 77%, thanks to cooperation between the government and the business sector. Businesses and jobs in rural areas may benefit greatly from the expansion of e-commerce and other forms of commercialization.
6. Online Networking
Even in more remote places, the use of digital technologies like cellphones and internet access is on the rise. Because of this, new avenues for communication, e-commerce, and digital service access have opened up. It opens up the realm of online education and digital platforms to rural areas, allowing them to engage with the broader world.
7. Online trade and purchasing
Online shopping has become increasingly popular in rural India as internet access has improved. The convenience of online shopping and delivery services has made it possible for people in remote locations to access a wider variety of goods and services without leaving their homes. The convenience and availability of a wider selection of items for rural consumers have been greatly enhanced by this.
8. Rural Business Ownership
Rural entrepreneurship, in which residents launch their companies, is on the rise. Agriculture, small-scale manufacturing, arts and crafts, and locally focused services all fall under this category. Start-Up India and the Mudra Yojana are two government programs that have helped rural businesses by giving them funding and connecting them with mentors.
9. Raising rural youths’ educational attainment and employability
The importance of education for their children became clear to the villagers. Thanks to their schooling and media exposure, most rural adolescents, particularly teenagers, are familiar with items. A primary school is within a 1-kilometer walk in 90% of the settlements, indicating significant progress in literacy rates. There has been a 5.5% increase in the enrollment of rural Indian students in private schools throughout the last six years. In rural India, the literacy rate has likewise increased by 68.91%. These initiatives increased the employability of young people in rural areas; as a result, they are less likely to lounge around doing nothing and more likely to travel to neighboring towns in search of work.
10. Policies and Incentives from the Government
Operation Flood (White Revolution), the Blue Revolution, the Yellow Revolution, and other programs implemented by the government to promote self-sufficiency led to the annual production of 15 million tons of milk. The agricultural sector in India received a boost in the 1970s when the government instituted programs such as the Integrated Rural Development Programme (IRDP) and the Rural Electrification Programme (REP). As a result, people’s routines and social lives underwent transformations. The growing consumer durable industry owes a great deal of gratitude to the Rural Electrification Programme (REP).
11. The media
Merchandise and services in rural regions are in high demand due to the influence of the media. The most astute marketers are boosting product demand by using a combination of traditional and non-traditional media. Cable television has played a significant role in changing the thinking and lifestyle of rural people.
12. Computer use in rural India
Opportunities for education, test scores, career guidance, employment, government programs and services, health and legal counsel, global news and information, property records, mandi prices, weather predictions, bank loans, and livelihood options will all be available to today’s rural youth as they grow up. If television has the power to alter the vocabulary used to talk about brands in rural India, then the proliferation of inexpensive Internet access via different kinds of communication hubs will undoubtedly alter the value of the information that is traded. As the culture of technology and electronics expands, new opportunities are emerging in rural India.
Conclusion
Positive tendencies have emerged in the context of rural trade. It not only affords huge eCommerce organizations the possibility to expand their operations to a market that may not yet be fully exploited, but it also gives small and medium-sized businesses the opportunity to have a first-mover advantage and be able to participate in the rural revolution that commerce is bringing about in the sector. The general commercial growth rates of rural areas of the country have been excellent, thanks to factors such as increased purchasing power, a higher literacy rate, improvements in the expansion of the service sector, the availability of new technology, and high-speed internet. The pattern is anticipated to persist into the foreseeable future.
In the past, the rural market was disregarded because it required additional allure in order to generate profits in business. However, in today’s world, rural markets are also gaining prominence as a result of their ability to generate market income.
Phase I (Prior to the 1960s)
Rural marketing encompassed the marketing of rural products in both rural and urban locations, as well as agricultural supplies in rural markets. It was considered synonymous with ‘agricultural marketing.’ Agricultural commodities such as food grains and industrial inputs such as cotton, sugarcane, and so on were the principal products marketed during this time.
The rural economy was in its basic stage, with conventional agricultural methods, so the scope of farm mechanization equipment (tractors, pump sets, and threshers) and agricultural inputs such as fertilizers, seeds, and pesticides was quite limited. The market was completely unstructured.
Phase II (1960s-1990s)
During this phase, the ‘green revolution’ transformed rural India by introducing scientific farming practices. Improved irrigation facilities and the use of fertilizers, insecticides, and high-yield variety seeds, combined with the use of instruments like tractors, power tillers, harvesters, pump sets, and sprinklers, resulted in increased agricultural productivity, transforming the very substance of rural markets. During this time, in addition to traditional “agricultural marketing,” a new area—”marketing of agricultural inputs”—arose.
Phase III (1990s onward)
Throughout this period, India’s industrial sector grew in strength and maturity. A new service sector formed, signaling the transformation of an agricultural society into an industrial one.
Meanwhile, the increased plan outlay by the Central and State governments for rural development and strengthening of local governance (via Panchayati raj institutions) resulted in socioeconomic growth. Furthermore, economic changes sped the process by introducing market competition. All of these reasons contributed to the expansion of rural marketplaces.
Phase IV: Decade of Ignorance (To the year 2000)
Infrastructure in rural areas is lacking, particularly in terms of village roads, local transportation, and communication. The majority of the population practiced subsistence agriculture. Corporate brands are not available in rural areas, with the exception of Unilever, ITC, Eveready, and a few other brands.
Phase V: (The Decade of Doubt spans from 2001 to 2010)
There is still a lack of conviction among corporations on the potential for the growing demand to justify investments in rural distribution infrastructure. Companies that choose to disregard the rural market will be doing so at their own risk.
Phase VI: (Between 2011 and 2020, the Decade of Demand)
For each and every category, rural demand increased at a quicker rate than urban demand, and for several products, including televisions, pressure cookers, two-wheelers, and others, the number of sales reported in rural areas was larger than in urban areas.
Both consumption and penetration levels were reduced, which resulted in increased headroom for expansion. 100% of the villages are connected by all-weather roads, and 90% of the settlements are electrified. Urban and rural teenagers have similar aspirations. The rise of the non-farm sector and the increase in employment opportunities in recently formed factories in surrounding small towns both contributed to a significant increase in the per capita incomes of rural residents.
Phase VII: A Decade of Digital and Digital Media (2021–2030)
The number of online connections and mobile phones has skyrocketed in recent years. Other companies, including Amazon, are increasingly delivering goods to faraway regions. The literacy rate of rural women has increased by more than 70 percent, while technology and artificial intelligence are revolutionizing agriculture and electronic mandis.
I. RURAL MARKET STRATEGIES WITH SPECIAL REFERENCE TO SEGMENTATION, TARGETING, AND POSITIONING.
Introduction
Segmentation
Rural markets in India are segmented based on factors such as geography (villages, regions), demographics (age, income, occupation), psychographics (lifestyle, aspirations), and purchasing behavior. For example, HUL segments rural consumers by income and product usage patterns, identifying needs for basic hygiene and affordable products.
Targeting
After identifying the segments, companies choose the target groups that best align with their products. For rural India, companies often target low- and middle-income groups seeking value for money and essential goods. For instance, Coca-Cola targeted rural youth and families by launching smaller, affordable “Chota Coke” bottles at ₹5, making it accessible to rural consumers.
Positioning
Brands position their offerings by aligning with rural aspirations, trust, and value. HUL positions its “Lifebuoy” soap around health and hygiene, communicating its benefits through local influencers and rural media. Likewise, ITC’s e-Choupal initiative positioned ITC as a farmer-friendly company by providing digital resources and transparent pricing, building trust and loyalty.
A. SEGMENTATION
Segmentation involves dividing the rural market into distinct groups based on various characteristics to better understand consumer needs and tailor marketing efforts.
Types of Segmentation in Rural Markets:
Geographic Segmentation:
Dividing rural areas by regions, states, climate, or village size.
Example: FMCG companies often design different product packages for North vs. South India due to climate differences.
Demographic Segmentation:
This segmentation is based on factors such as age, gender, income, education, and occupation.
Example: Tata Tea targets different age groups with its “Jaago Re” campaign, focusing on youth and middle-aged adults.
Behavioral Segmentation:
This segmentation is based on factors such as usage rate, brand loyalty, and purchasing behavior.
Example: Mobile companies offer special recharge plans for heavy users in rural areas.
Psychographic Segmentation:
This segmentation is based on factors such as lifestyle, values, and aspirations.
1. HUL’s Project Shakti: Hindustan Unilever Limited (HUL) segmented rural women with entrepreneurial aspirations and trained them to become direct-to-home sales agents (Shakti Ammas). This approach tapped into women as both consumers and influencers, allowing HUL to reach the “household decision-maker” segment in rural India.
2. ITC e-Choupal: ITC segmented rural farmers based on crop type and region to launch its e-Choupal initiative. The company set up digital kiosks in villages, providing market information tailored to different segments (soybean farmers in Madhya Pradesh, wheat farmers in Uttar Pradesh, etc.).
3. Coca-Cola’s “Chhota Coke”: Coca-Cola segmented the market by purchasing power and consumption patterns, introducing a ₹5 “Chhota Coke” (small Coke) for low-income rural consumers who preferred affordable, single-use products.
4. LG’s Rural Appliances: LG Electronics segmented villages by electricity availability and income levels, launching semi-automatic washing machines and “Power Cut” TVs tailored for rural households.
Summary: Segmentation in rural markets helps companies identify specific consumer needs and develop targeted strategies. Successful brands like HUL, ITC, Coca-Cola, and LG use geographic, demographic, behavioral, and psychographic segmentation to effectively penetrate rural India.
B. TARGETING IN RURAL MARKET STRATEGIES
Targeting refers to selecting specific segments identified through segmentation and focusing marketing efforts on them to maximize effectiveness in rural markets.
Key Approaches to Targeting in Rural Markets:
Focusing on Income Groups
Companies often target low- and middle-income consumers by offering affordable products and value packs.
Example:Coca-Cola’s “Chhota Coke” at ₹5 was designed to target cost-sensitive rural customers, making the brand accessible to a wider audience.
Targeting Women as Influencers
Recognizing that women often make household purchasing decisions, campaigns are tailored to engage them directly.
Case Study: HUL’s Project Shakti HUL targeted rural women by training them as direct sales agents (“Shakti Ammas”), empowering them and using their local influence to expand product reach in villages.
Targeting Rural Youth
Brands target younger rural consumers, who are aspirational and open to new products.
Example:Hero MotoCorp tailors advertising for affordable motorcycles to young men in villages, highlighting style and fuel efficiency.
Village Size and Accessibility
Companies may target larger or more accessible villages first for logistical efficiency.
Example:ITC’s e-Choupal program began in larger, agriculturally important villages, targeting progressive farmers who could influence others.
Occupation-Based Targeting
Brands target farmers, artisans, or small business owners with products suited to their needs.
Example:Mahindra Tractors targets small and marginal farmers needing affordable, fuel-efficient tractors.
Case Studies
HUL’s Wheel Detergent: Targeted low-income rural households with a low-cost detergent, distributed via local retail networks and direct saleswomen.
Colgate-Palmolive: Targeted rural families by promoting oral hygiene education in schools, building trust, and encouraging mothers to adopt Colgate for their children.
Godrej Chotu Kool: Targeted rural households without refrigerators, offering a compact, affordable fridge designed for the rural market.
Summary: Targeting in rural markets is about understanding specific needs—be it cost, convenience, or local influence—and tailoring strategies to reach and win over key consumer groups. Successful brands like HUL, Coca-Cola, and Mahindra have grown in rural India by precisely identifying and targeting their ideal rural customers.
C. POSITIONING IN RURAL MARKET STRATEGIES
Positioning involves creating a distinct image and value proposition for a product or brand in the minds of rural consumers, often by connecting with their aspirations, values, and daily needs.
Examples and Case Studies
1. Mahindra Tractors—“Rise“for Good” Positioning Mahindra positioned its tractors as partners in progress for the Indian farmer. The brand emphasizes reliability, ruggedness, and empowerment, using slogans like “Rise for Good.” Mahindra’s rural marketing focuses on demos, farmer meets, and real-life success stories, making the tractor a symbol of pride and aspiration for progressive farmers.
2. Hero MotoCorp – “Har Ghar Mein Hero” Hero MotoCorp positioned its motorcycles as affordable, fuel-efficient, and reliable vehicles for the rural youth and families. Through targeted campaigns like “Har Ghar Mein Hero” (“A Hero in Every Home”), the brand associates bike ownership with upward mobility and independence, resonating with rural aspirations.
3. Godrej ChotuKool—“Cooling“for All” Godrej positioned ChotuKool as an innovative, affordable cooling solution for rural households lacking access to traditional refrigerators. The product is marketed as simple, portable, and specifically designed for rural conditions, making refrigeration accessible and aspirational.
4. Emami Navratna Oil—“Thanda Thanda Cool Cool.” Emami positioned Navratna Oil as a remedy for the stresses and heat of rural life, using the tagline, “Thanda Thanda Cool Cool.” The brand focused on the cooling and stress-relief aspects in its communication, using local language ads and rural influencers to reinforce the product’s relevance.
5. CavinKare Chik Shampoo—“Sastha“aur Accha” CavinKare positioned Chik Shampoo in the rural market as a high-quality yet affordable product, introducing single-use sachets priced at ₹1. This made shampoo accessible to rural consumers and positioned Chik as a “value-for-money” brand for households with limited budgets.
Summary: Effective rural positioning involves understanding rural needs and aspirations, then crafting a message that connects emotionally and practically. Brands like Mahindra, Hero MotoCorp, Godrej, Emami, and CavinKare have succeeded by positioning their products as solutions to rural problems and symbols of progress.
A. Understanding basic difference between Rural and urban consumers’ behavior
B. Understanding the nature of competition in rural marketing.
Introduction
In India, rural consumers value quality, durability, and community involvement more than urban consumers who seek ease, brands, and trends. This is because rural spending (68.84% of population) is higher than urban spending (31.16%). Because their wages change with the seasons, people in rural areas like small packs and local shops, while people in cities choose high-end, tech-driven purchases. In rural areas, loyalty is shown through symbols, and in cities, it’s shown through ads.
Key Differences
Aspect
Rural Consumers
Urban Consumers
Purchase Frequency
Weekly, small packs for affordability
Less frequent, bulk/economy packs
Brand Loyalty
High via color/logo, less ad-driven
Brand-conscious, influenced by trends
Shopping Channels
Village shops, haats for credit/bargains
Malls, online for convenience
Decision Factors
Family/elders, price sensitivity
Individual, tech/products
Product Preference
Durables for utility, sachets
Advanced gadgets, fast food
Examples
Rural: Bihar villagers buy FMCG sachets post-Digital India exposure, valuing presence over ads. Urban: Delhi youth prefer online fast food via apps, prioritizing speed. Rural favors two-wheelers for practicality; urban opts luxury cars for status.
Case Studies
Godrej’s “Godrej Ki Doli” campaign reached 1 crore+ rural consumers in 28,000 UP/AP/Maharashtra villages via door-to-door, contacting 1.7 lakh retailers and building loyalty without heavy ads. Bihar online buying study showed rural 35% rise via YouTube, but urban leads in tech adoption due to infrastructure. Migrants from rural to urban retain haat habits initially but shift to malls.
A. BASIC DIFFERENCES BETWEEN RURAL AND URBAN CONSUMER BEHAVIOR
1. Income and Spending Power
Rural Consumers: Usually have lower and more irregular incomes, leading to cautious spending and preference for affordable products.
Urban Consumers: Typically have higher, more stable incomes, allowing greater discretionary spending and willingness to try premium or new products.
2. Product Awareness and Information Sources
Rural Consumers: Rely more on word-of-mouth, local opinion leaders, and traditional media (radio, regional TV). Advertising impact is limited unless localized.
Urban Consumers: Exposed to multiple information channels like digital media, TV, print, social networks. More aware of brands and product options.
3. Buying Behavior
Rural Consumers: Prefer small pack sizes (sachets, single-use), buy less frequently, and make purchases mostly from local kirana stores or markets. Price sensitivity is high.
Urban Consumers: Buy in bulk or larger packs, shop more frequently in supermarkets, malls, and online platforms. More brand and quality conscious.
4. Brand Loyalty
Rural Consumers: Less brand loyal; will switch brands for price or availability.
Urban Consumers: More likely to be brand loyal, influenced by advertising and perceived quality.
5. Influencers
Rural Consumers: Influenced by family, community leaders, and local traditions.
Urban Consumers: Influenced by celebrities, social media influencers, peer groups, and advertising.
6. Payment Methods
Rural Consumers: Prefer cash; digital payment adoption is growing but still limited.
Urban Consumers: Comfortable with digital payments, cards, and wallets.
Example
Shampoo Purchase:
Rural Consumer: Buys ₹1 sachet from a kirana shop, influenced by neighbor’s recommendation.
Urban Consumer: Buys a branded family-size bottle from a supermarket or online, influenced by TV/online ads.
Case Study 1: Sachet Revolution (Hindustan Unilever Limited)
Problem: HUL’s shampoo bottles were too expensive for rural consumers, who were hesitant to spend a large amount at once.
Solution: HUL introduced ₹1 shampoo sachets, making the product affordable and accessible for rural consumers who preferred buying in small quantities.
Impact:
Massive increase in rural sales.
Urban consumers continued buying large bottles, valuing convenience and long-term savings.
Learning: Rural consumers prioritize affordability and immediate needs, while urban consumers value convenience and are less sensitive to price per unit.
Case Study 2: Mobile Phones – JioPhone vs. Smartphones
Situation: Urban consumers demand smartphones with advanced features for communication, work, and entertainment.
Solution for Rural Markets: Reliance Jio launched the JioPhone, an affordable internet-enabled feature phone, catering to rural needs for basic connectivity and long battery life.
Urban buyers continued purchasing high-end smartphones (Samsung Galaxy, iPhone).
Learning: Urban consumers seek technology and status, while rural consumers focus on essential functions and affordability.
Case Study 3: Media Consumption and Advertising
Scenario: A detergent brand wants to reach both rural and urban markets.
Approach:
Urban: Runs TV and digital ad campaigns featuring celebrities, and partners with e-commerce sites.
Rural: Sponsors local events, uses folk media, and organizes product demonstrations at village fairs, relying on word-of-mouth.
Impact: Urban sales rise due to aspirational advertising; rural sales grow through trust-building, personal interaction, and localized messaging.
Conclusion:
Rural consumer behavior is driven by price, accessibility, and local influence, while urban consumer behavior is shaped by higher income, brand value, modern retail, and digital exposure. Successful businesses tailor their strategies to these fundamental differences.
B. UNDERSTANDING THE NATURE OF COMPETITION IN RURAL MARKETING
Nature of Competition in Rural Markets
Fragmented Market: Many small players and unorganized local brands compete with large national brands.
Low Brand Loyalty: Rural consumers often switch brands based on price, availability, or local influence.
Price Sensitivity: Price is a key factor; even a small difference can sway consumers.
Distribution Challenges: Companies compete to reach remote locations and ensure product availability.
Communication Barriers: Marketing must overcome language, literacy, and cultural diversity.
Trust and Relationship Building: Local relationships and word-of-mouth are vital; brands often compete for trust as much as for sales.
Product Adaptation: Competition may lead to product modifications (smaller packs, local flavors, etc.) to suit rural needs.
Non-traditional Promotions: Competitors use fairs, melas, van campaigns, and local influencers instead of only mass media.
Case Studies and Examples
Case Study 1: HUL vs. Local Brands – Detergent Market
Scenario: Hindustan Unilever Limited (HUL) markets Wheel detergent in rural India, but faces competition from local, unbranded detergents sold at lower prices.
Competitive Strategies:
HUL introduced smaller, affordable sachets.
Launched rural-specific promotions (e.g., “Wheel Lucky Draw” at village fairs).
Built a robust rural distribution network using local wholesalers.
Outcome: Wheel became a leading rural brand, but HUL had to continually innovate on price, pack size, and promotions due to persistent competition from local brands.
Case Study 2: Colgate vs. Neem Sticks
Scenario: Rural India traditionally used neem sticks for oral hygiene.
Competitive Approach:
Colgate marketed toothpaste in small sachets to make it affordable.
Ran educational campaigns in villages about dental hygiene, sometimes partnering with local health workers.
Sponsored rural events and distributed free samples.
Outcome: Colgate became the No.1 toothpaste in rural India, but competition from traditional practices and local brands remains strong, requiring ongoing education and adaptation.
Case Study 3: Britannia vs. Local Bakeries
Scenario: Britannia aimed to grow biscuit sales in villages where local bakeries sold loose, unpackaged biscuits.
Competitive Moves:
Introduced low-priced “Tiger” biscuits in small packs (₹2–₹5).
Partnered with rural retailers and offered incentives.
Used mobile vans to reach remote villages, creating brand visibility.
Outcome: Britannia gained a strong rural presence, but continues to face price and availability competition from local bakers.
Demography of Rural marketing: Population, Occupation Pattern, literacy rate, Income source, Expenditure Pattern, Rural Demand and Consumption pattern, Rural Housing, Education, Electricity, Roads.
Introduction
Rural marketing in India targets the vast demographic of approximately 65-68.84% of the population residing in rural areas, where over 900 million people live across diverse villages, influencing consumption patterns for FMCG, agri-inputs, durables, and services. Key characteristics include a youthful skew, rising but uneven incomes, improving literacy, and seasonal employment dominated by agriculture, making value-for-money products and localized strategies essential.
1. Population
India’s rural population constitutes approximately 63-65% of the total 1.41 billion (2025 estimates), equating to over 900 million people across 6.27 lakh villages, though this share is declining due to urbanization (from 68.84% in 2011). Rural areas drive 40-50% of national consumption, with a youthful demographic (55% under 25) and improving infrastructure boosting market potential.
Recent data highlights significant trends in India’s rural population:
Declining Rural Proportion: In 2024, rural areas accounted for 63.1% of India’s total population, a decrease from 63.4% in 2023. This reflects ongoing urbanization, with the rural share having declined from 81.5% in 1960. (helgilibrary.com)
Economic Growth: Rural consumption has been rising steadily, narrowing the urban-rural expenditure gap. In 2023-24, the average monthly per capita consumption expenditure (MPCE) in rural areas was ₹4,122, up 9% from the previous year. This growth is particularly notable among the bottom 5-10% of the population, indicating more equitable economic development. (ddnews.gov.in)
Poverty Reduction: Rural poverty has significantly decreased, dropping to 4.86% in the fiscal year ending March 2024, down from 25.7% in 2011-12. This improvement is largely attributed to government support programs and increased consumption. (timesofindia.indiatimes.com)
Employment Trends: The unemployment rate in rural areas fell to 4.4% in the July-September 2025 quarter, aided by seasonal agricultural employment and a rise in female workforce participation. (reuters.com)
These developments underscore the dynamic nature of India’s rural demographics, influenced by urban migration, economic policies, and social changes.
Rural Population Overview Table (2024-25 Estimates)
Metric
Value/Percentage
Details/Trends
Total Rural Population
~916-920 million (63.13%)
Down from 833M (68.84%) in 2011; growth rate ~0.9% annually.
Male Rural
~470 million (51.2%)
Sex ratio 950 females/1000 males.
Female Rural
~446 million (48.8%)
Rising female LFPR in non-farm sectors.
Share of National Population
63.13% (2024)
Projected to fall to ~60% by 2030.
Density
~300-400/sq km (varies regionally)
High in Indo-Gangetic plains; low in central India.
Household Size (Avg.)
4.5-5 persons
Nuclear families rising in semi-rural.
Youth (Under 25)
55%
Drives digital/FMCG demand.
State-wise, UP (155M+ rural), Bihar (110M+), Maharashtra (60M+) lead; urbanization fastest in south/west. This base supports rural marketing via haats/digital.
2. Occupation Pattern
Agriculture remains the dominant occupation in rural India, employing nearly 60% of the rural workforce, but non-farm sectors like construction, manufacturing, and trade are growing rapidly, reflecting diversification amid stagnant farm productivity. Between 2011-12 and 2023-24, agricultural employment fell from 63.3% to 57.6%, while non-farm jobs rose from 36.9% to 42.4%, driven by schemes like MGNREGA, remittances, and urbanization pressures.
Agriculture is the primary occupation for about 50-55% of the rural workforce.
Allied activities such as dairy, poultry, fishing, and forestry supplement income.
Increasing diversification with non-farm activities like small-scale industries, handicrafts, and service sector jobs.
Seasonal migration to urban areas for additional income is common.
Self-employment is a significant component of rural livelihoods.
Key Occupation Patterns
Sector/Sub-Sector
Workforce Share (2023-24)
Characteristics and Trends
Agriculture & Allied
~57.6-60%
Dominant for both genders; 73% self-employed (own-account/family labor). Declining due to fragmentation; females 70.9% in Q1 2025. Includes crops, dairy, fisheries.
Construction
~10-15% (top non-farm)
Major non-agri employer; male-heavy, seasonal/migratory; boosted by infra projects.
Manufacturing
~8-10%
Rural SMEs, agro-processing; rising with PLI schemes. Younger workers prefer.
Wholesale/Retail Trade
~7-9%
Haats, kirana shops; female participation growing in trade/education.
Services (Health/Edu)
~5-7%
Emerging for educated females; gig jobs via apps.
Others (MGNREGA/Wages)
~10-15%
Distress employment; 44.6% rural males in agri/services Q1 2025.
Gender and Age Dynamics
Males: Shifting to non-farm (construction/trade); prime-age (25-45) lead diversification.
Females: 75%+ in agri; rising in health/education (e.g., ASHA workers); LFPR varies (37.2% national rural avg).
Youth (Under 35): Prefer non-farm; higher education correlates with mobility.
This shift supports rural marketing by stabilizing incomes for durables/FMCG, though seasonal unemployment demands credit-linked, harvest-timed strategies.
3. Literacy Rate
Rural India’s literacy rate for individuals aged 7 and above stands at 77.5% as of 2023-24, marking a significant 10 percentage point rise from 67.77% in 2011, driven by schemes like Samagra Shiksha and ULLAS (Nav Bharat Saaksharta Karyakram). This progress lags behind urban India’s 88.9%, with a persistent gender gap: male literacy at 84.7% (up from 77.15%) and female at 70.4% (up from 57.93%). Regional disparities are stark, with southern states like Kerala exceeding 95% while Bihar and Rajasthan hover below 73% in rural areas.
Rural literacy has been steadily improving but remains lower than urban literacy.
As per latest data, rural literacy is around 70-75%, with a gender gap favoring males.
Educational infrastructure is growing, with increased enrollment in primary and secondary schools.
Literacy improvements contribute to better awareness and media access, influencing rural consumption.
Gender and Age Breakdown
Males: 84.7% literate, benefiting from higher school enrollment and labor migration exposure.
Females: 70.4%, showing faster growth due to targeted interventions like Beti Bachao Beti Padhao and female teacher recruitment; however, dropout rates remain higher post-primary.
Youth (7-25 years): Over 85-90% in many areas, fueling digital adoption; elderly (above 60) lag at ~60-65%.
State-wise Rural Variations (2023-24 Estimates)
State/Region
Rural Literacy Rate
Key Factors
Kerala
95%+
High female enrollment, quality schools
Mizoram
98% (near full)
Community-driven education
Bihar
~72%
Poverty, teacher shortages
Rajasthan
72.5%
Gender gaps, arid regions
MP
71.6%
Tribal disparities
Marketing Implications
Rising literacy enhances media consumption (TV, mobile over print), brand comprehension, and e-commerce trials (52% digital access). Marketers target visual/vernacular content for the 22.5% illiterate segment via haats and influencers, while leveraging educated youth for premium FMCG/durables penetration.
4. Income Sources
Rural India’s income sources have diversified beyond agriculture, with average household income reaching ~₹1.22 lakh annually (2023-24), supported by non-farm growth, government schemes, and remittances, stabilizing consumption despite seasonality. Agriculture remains primary (50-60%), but non-farm contributions rose to 40-45% by 2025, driven by construction, services, and rural enterprises amid optimistic sentiments (74-79% households expect rises).
Primary Income Sources
Source
Share (%)
Details and Trends
Agriculture & Allied
50-60
Crops (40-50%), livestock/dairy (10-15%), fisheries; nominal per capita ~USD 1,145 (FY25). Declining reliance due to fragmentation; resilient via MSP/DBT.
Wages/Labor
20-25
MGNREGA (100+ days/year for 5-10 crore households), casual farm/non-farm; females dominant in agri-wages.
Non-Farm Businesses
10-15
Rural SMEs (agro-processing, trade, manufacturing); 7.1% CAGR (FY22-25) in industry sector.
Remittances
5-10
From 20-30M seasonal migrants; boosts durables in origin villages.
Government Schemes
10-15
PM-KISAN (₹6,000/year to 11Cr farmers), pensions, subsidies (~10% monthly income via food/fertilizer/electricity transfers).
Diversification: 112 rural districts (291M pop.) crossed USD 2,000 per capita; services per capita >USD 3,000 in leading states (TN, MH).
Gender Split: Males in non-farm (construction/mining); females agri/services.
Optimism: 42% reported rises in past year; formal credit access at 58% supports expansion.
This mix enables marketing of value FMCG/durables during harvest peaks, leveraging Direct Benefit Transfer (DBT) for liquidity.
Explanation:
Agriculture remains the primary income source for the majority of rural households.
Agricultural labour provides wage income to landless or marginal farmers.
Non-farm employment is growing as rural economies diversify.
Self-employment in retail, services, and crafts is significant in rural areas.
Remittances from migrant workers contribute notably to household income.
Government transfers have become important in supplementing rural incomes.
This income diversification reflects the changing economic landscape in rural India, with growing reliance on multiple income sources beyond traditional farming.
5. Expenditure Pattern
Rural India’s expenditure patterns reflect a shift towards non-food items, with average Monthly Per Capita Expenditure (MPCE) rising to ₹4,122 in 2023-24 from ₹1,430 in 2011-12, outpacing urban growth at 9.2% annually. Food accounts for 47-48% of spending (down from 53%+ historically), while non-food dominates at 52-53%, driven by education, health, durables, and communication amid resilient incomes from schemes like MGNREGA and remittances.
Breakdown of Expenditure (2023-24 Averages)
Category
Share of MPCE (%)
Key Trends and Details
Food (Total)
47.04%
Processed foods (9.84%, highest growth), milk/products (8.44%), vegetables (6.03%), cereals (4.99%). Shift from staples to packaged/convenience items.
Mobiles/data surging with 52% digital penetration.
– Durables/Entertainment
6-7%
Fans, TVs, two-wheelers; festival-driven.
– Clothing/Footwear
6-7%
Aspirational buys; small packs preferred.
– Rent/Conveyance
5-6%
Fuel, PMGSY-enabled travel.
Household-Level Insights
Quarterly household spending hit ₹46,623 (up 33% from 2022’s ₹36,104), with 79% households reporting higher consumption. Top 5% spend 6x more than bottom quintile, signaling intra-rural inequality; 81% save post-harvest. Cautious patterns favor value packs, discounts, haats (70% buys), and e-commerce trials amid inflation moderation.
Marketing Implications
Prioritize sachets, EMI for durables, vernacular digital ads for non-food growth. Festivals/harvests spike impulse buys; DBT liquidity (Jan Dhan) enables premium trials despite seasonality.
6. Rural Demand and Consumption Pattern
Rural demand and consumption patterns in India showcase resilience and rapid evolution, with rural areas driving 51% of affordable premium FMCG volumes in 2025, outpacing urban markets for five straight quarters amid narrowing rural-urban gaps (MPCE disparity at 69.7% in 2023-24). Non-food spending exceeds 53% of household budgets (up from food-dominant past), fueled by rising incomes (₹1.22 lakh annual avg.), DBT liquidity, and schemes like MGNREGA, enabling shifts to durables, processed foods, and e-commerce (4-8% penetration).
Key Patterns and Trends
FMCG Surge: Rural contributes 42% super-premium volumes (up from 30% in 2020); low-unit packs (₹5-10 sachets declining, larger value packs rising) boost trials for noodles, biscuits, oils. Growth at 9-11% YoY, led by Parle/Marico via localized variants.
Intra-rural inequality persists (top 5% spend 6x bottom), but aspirations and financial inclusion (67% Jan Dhan rural) position rural as GDP growth engine (2/3 consumption-driven). Marketers focus on visual/vernacular ads, EMIs, haats for sustained penetration.
7. Rural Housing
Rural housing patterns in India reflect a transition from traditional kuccha (mud/thatch) to pucca (brick/concrete) structures, driven by PMAY-G, with over 70% households now in semi-pucca or pucca homes as of 2025. Homeownership exceeds 94% in rural areas, highest in northern states like Bihar (96.7%), supported by ancestral land holdings and subsidies up to ₹2.67 lakh per unit.
Rural housing in India is undergoing a major transition from kuccha (temporary) to pucca (permanent) structures, driven largely by government schemes and rising rural incomes. Conditions still vary widely by state and region, but overcrowding, poor sanitation, and climate vulnerability are steadily reducing where programmes are effectively implemented.
Overall Status and Housing Types
Most rural households now live in semi‑pucca or pucca houses, with the share of fully kuccha dwellings falling rapidly over the last decade. Typical rural homes range from single‑room brick or mud houses with tin/asbestos roofs to multi‑room concrete houses with separate kitchen and toilet, especially in states that have aggressively implemented housing schemes. Many poorer families still lack adequate ventilation, sanitation, and safe structures, especially in flood‑ or drought‑prone belts and among landless labourers.
PMAY‑G and Government Efforts
The backbone of rural housing improvement is Pradhan Mantri Awaas Yojana–Gramin (PMAY‑G), which aims at “Housing for All” in rural India. The original target of about 2.95 crore houses (2016–17 to 2023–24) has been extended to a cumulative 4.95 crore houses by 2028–29; by August 2025, around 3.85 crore houses had been sanctioned and over 2.82 crore completed. The scheme provides financial assistance for a minimum 25 m² pucca house with basic amenities and often converges with toilets, drinking water, LPG and electricity schemes, significantly improving overall living standards.
Quality, Amenities and Regional Variation
PMAY‑G houses are designed as disaster‑resilient pucca units with separate cooking area and scope for household toilets, and a large share are registered in the name of women or jointly, improving tenure security and gender empowerment. Despite this, regional gaps persist: some states and hilly or remote districts still show delays, incomplete units, or overcrowding, and there remains a backlog of households in kuccha or dilapidated housing that must be addressed under the extended targets to 2028–29.
Housing Types and Distribution
Housing Type
Share of Rural Households (%)
Characteristics and Trends
Pucca
50-60%
Permanent brick/concrete; separate rooms, kitchen, toilet; PMAY-G focus (2.82 crore completed by 2025).
Semi-Pucca
25-30%
Brick walls, tin/tiles roof; transitional, common in central/eastern states.
Kuccha
10-15%
Mud walls, thatch roof; declining rapidly (<20% from 1990s); persists in tribal/remote areas.
Dilapidated
5-10%
Unsafe, targeted for PMAY upgrades; backlog ~1.1 crore units.
Regional and Ownership Patterns
Northern/BIMARU states (Bihar 96.7%, UP 95.8%, MP 95.3%) lead ownership due to agri-land; southern states (Kerala 87.2%, TN 86%) show urban migration effects. Average size: 4-5 rooms; women/joint ownership rising via PMAY. Challenges include overcrowding (avg. 5/person), sanitation gaps.
PMAY-G targets 4.95 crore houses by 2029, converging with water/electricity, boosting durables demand (paints, fans) and EMIs.
8. Education
Education in rural India has achieved near-universal primary enrollment (95%+ for ages 6-14) but grapples with quality gaps, high dropouts at secondary levels (10-15%), teacher shortages, and infrastructure deficits, as highlighted in the 2024 ASER report. Government schools serve 66.8% of students (down from 72.9% in 2022 due to private shifts), with foundational literacy/numeracy improving via NIPUN Bharat, yet only 45.8% of Class 8 students master basic arithmetic. Schemes like Samagra Shiksha and mid-day meals boost retention, while digital divides persist despite rising smartphone access.
Note: Ladakh recently became a fully ‘functionally literate’ administrative unit by achieving a 97% literacy rate after the implementation of the centrally-sponsored scheme ULLAS – Nav Bharat Saaksharta Karyakram or the New India Literacy Programme, which was launched in alignment with the New Education Policy 2020 (NEP 2020) in 2022.
Shift to private (33.2%); pre-primary up to 50%+ for ages 3-5.
Learning Outcomes (Class 3 Reading)
27.6% can read Std 2 text
Improved from 20.2% (2022); arithmetic subtraction: 27.6%.
Class 8 Proficiency
45.8% basic arithmetic; ~50% reading
Stagnant; boys outperform girls in digital skills (75%+ tasks).
Teacher Attendance
87.5%
Up from 85.1% (2018); student attendance 75.9%.
Dropout Rate (Secondary)
10-15%
Higher for girls; NSS shows 85%+ gross enrollment ratio ages 6-17.
School Infrastructure
52.1% primary schools <60 students
Toilets/electricity near 95%; drinking water gaps in remote areas.
Digital Literacy (Ages 14-16)
75%+ complete basic tasks
Messaging/browsing strong; gender gap favors boys.
Regional leaders like Kerala/Mizoram exceed 95% literacy/enrollment; BIMARU states lag. Marketing implications include rising demand for edtech, coaching, and youth-targeted products as 111 million middle-class households emerge.
Education level in rural India
Education levels in rural India have improved significantly, with near-universal primary enrollment (95%+ for ages 6-14) and overall literacy reaching 77.5% (2023-24), but quality gaps persist: only 27.6% of Class 3 students can read Std 2 text, and 45.8% of Class 8 students master basic arithmetic per ASER 2024. Government schools dominate (66.8% enrollment, down from 72.9% in 2022 due to private shifts), with secondary dropouts at 10-15% and digital skills strong among youth (75%+ for ages 14-16). NSS 2025 shows 85%+ gross enrollment ratio (ages 6-17), but females lag in higher education.
Education Level Distribution (Rural, Ages 7+; ASER/NSS 2024-25 Estimates)
Level/Age Group
Enrollment/Attainment (%)
Key Insights
Pre-Primary (Ages 3-5)
50%+
Rapid rise; govt pre-primary surging in states like Gujarat/Odisha.
Primary (Class 1-5, Ages 6-11)
95%+
Universal access; foundational learning up (Class 3 reading: 27.6%).
Upper Primary (Class 6-8, Ages 11-14)
85-90%
Attendance 75.9%; arithmetic proficiency stagnant at 45.8% (Class 8).
Secondary (Class 9-10, Ages 14-16)
70-75%
Out-of-school down to 7.5%; boys lead digital tasks (80%+ smartphone use).
Higher Secondary+ (Ages 17+)
40-50%
Private coaching boom; gender gap narrows but persists.
No Education/Illiterate
22.5%
Elderly/females dominant; declining via ULLAS scheme.
Challenges include teacher shortages (ratio worsening to 38:1 by 2028), infrastructure (52% small schools), and learning stagnation. Progress via NIPUN Bharat boosts early skills; 111M middle-class households drive edtech/coaching demand.
9. Electricity
Rural electricity in India boasts near-universal reach at 99-99.2% household connections, with average daily consumption supported by 21.9 hours of supply and national capacity at ~500 GW (51% non-fossil by late 2025). Rural consumption, though lower per capita than urban (~20-25% of total national demand), is rising rapidly for appliances, irrigation, and lighting, driven by schemes like RDSS and solar pumps.
Reach (Electrification Coverage)
India has achieved more than 99% household electrification overall, and rural areas specifically are estimated at about 99–99.2% access by 2023–24.
This expansion was driven by schemes like DDUGJY and SAUBHAGYA, which together electrified over 18,000 villages and gave connections to around 2.9 crore households previously lacking power.
Supply Level and Reliability
Average daily power supply in rural areas has improved from about 12.5 hours in 2013–14 to roughly 21.9 hours per day by 2023–24, sharply narrowing the gap with urban areas (about 23.4 hours).
The national energy deficit has fallen to about 0.1%, meaning most demand is now met, though some rural pockets still face outages or voltage fluctuations, especially during peak seasons or bad weather.
Capacity and System Strength
India’s total installed power capacity reached about 456–457 GW by late 2024, up roughly 7% year‑on‑year, with nearly 47% of this capacity from renewable sources (solar, wind, etc.).
Grid strengthening and a large distribution reform scheme (RDSS, with an outlay of about ₹3 lakh crore) aim to modernize rural feeders, add lines/transformers, and roll out smart meters to improve reliability and reduce losses.
Overall, rural India has moved from partial, low-hour access to near-universal electrification with around 22 hours of supply on average, but quality, affordability, and last‑mile reliability still vary by state and district.
Electricity Metrics Table (2023-25 Rural Focus)
Metric
Rural Statistic
Trends/Notes
Household Reach
99-99.2% (2.86 Cr via SAUBHAGYA)
Universal post-2018; PVTG focus ongoing.
Village Coverage
99.9% (18,374 villages)
DDUGJY complete; microgrids for remote.
Daily Supply Level
21.9 hours avg.
Up from 12.5 hrs (2015); gap with urban narrowing.
Consumption Share
~20-25% national total (~300-350 BU/year)
Agri (pumps 15-20%), domestic rising 8-10% YoY.
Installed Capacity
~40% national (200 GW rural feeders)
Renewables 51% total; solar rural pumps 5L+ units.
Per Capita Consumption
~1,200-1,400 kWh/year
Vs urban 2,500+; fans/TVs/mobile dominant.
10. Roads and Connectivity
Roads and connectivity in rural India have transformed dramatically through the Pradhan Mantri Gram Sadak Yojana (PMGSY), achieving 99% village connectivity with all-weather roads by 2025, covering over 7.83 lakh km completed across phases I-III. This network links 99% of eligible habitations (population >500), reducing travel times by 50-70%, boosting agri-marketing, healthcare access, and FMCG distribution via haats and e-commerce logistics.
Government Expenditure on Rural Roads under PMGSY (2000-2025)
The Indian government has allocated substantial funds through Pradhan Mantri Gram Sadak Yojana (PMGSY) phases, with cumulative expenditure exceeding ₹3 lakh crore by 2025, enabling 7.83 lakh km of roads and 99% village connectivity. FY26 budget stands at ₹19,000 crore, while PMGSY-IV outlay is ₹70,125 crore (2024-29).
Phase/Scheme
Period
Sanctioned Length (km)
Total Outlay/Expenditure (₹ Crore)
Central Share (₹ Crore)
Notes
PMGSY I
2000-2014
644,867
~2,38,000 (cumulative major)
N/A
Basic habitations (>500 pop.)
PMGSY II
2011-2020
49,794
~28,000
N/A
Upgrading existing roads
PMGSY III
2019-Ongoing
121,957
~58,000
N/A
Habitation-to-market links
PMGSY IV (New)
2024-29
62,500
70,125
49,088
25,000 unconnected habitations
RCPLWEA
Ongoing
Varies
Included in district totals
N/A
LWE-affected areas
FY25-26 Budget
2025-26
N/A
19,000
N/A
Annual allocation
Grand Total
2000-2025
8,38,611
~3,00,000+
~2,00,000+
Incl. 12,146 bridges
Expenditure supports green roads (1.66 lakh km), bridges, and PVTG areas, cutting logistics 20% and aiding rural marketing.
PMGSY Expenditure: Central vs. State Share (Key States, Recent Years)
Government expenditure on rural roads under Pradhan Mantri Gram Sadak Yojana (PMGSY) follows a 60:40 Central:State funding pattern (90:10 for hilly/North-East states), with cumulative outlay ~₹3 lakh crore by 2025. Central releases fund construction/maintenance; states contribute balance and execution. Below is a summarized table based on recent data (2022-25); exact figures vary by phase/fiscal.
State/Region
Central Release (₹ Crore, Last 3 Yrs)
State Share/Expenditure (₹ Crore)
Total Expenditure (₹ Crore)
Roads Completed (km)
Uttar Pradesh
~25,000
~15,000
~40,000
85,000+
Maharashtra
~18,000
~10,000
~28,000
45,000+
Bihar
~22,000
~12,000
~34,000
60,000+
Madhya Pradesh
~15,000
~9,000
~24,000
50,000+
Rajasthan
~12,000
~7,000
~19,000
35,000+
North-East/Hilly
~10,000 (90% Central)
~1,000
~11,000
25,000+ (PMGSY-III focus)
Total India
~1,50,000+ (60%)
~1,00,000+ (40%)
~3,00,000+
7.83 lakh km
Notes: FY26 allocation ₹19,000 Cr (Central); PMGSY-IV ₹70,125 Cr total (₹49,088 Cr Central). Funds support 1.91 lakh roads/12k bridges, with states handling maintenance (5-yr contracts). Green roads/PVTG areas get priority.
State-wise Central Funds Released under PMGSY (Last 5 Years, Approx. Cumulative ₹ Crore)
Exact 5-year state-wise data varies by fiscal and phase, but below is a compiled table from recent parliamentary disclosures (2020-25 estimates). Total central releases exceed ₹1.5 lakh crore, with 60:40 Centre:State ratio (90:10 for NE/hilly). Figures aggregate Phases I-IV; UP/Bihar lead due to population/roads.
State/UT
2020-21
2021-22
2022-23
2023-24
2024-25 (till date)
Total (₹ Cr)
Andhra Pradesh
872
667
607
520
~500
~3,166
Bihar
6,723
~8,000
~7,500
~6,000
~5,000
~33,223
Uttar Pradesh
~10,000
~12,000
~11,000
~9,000
~8,000
~50,000
Maharashtra
~6,000
~7,000
~6,500
~5,500
~4,500
~29,500
Madhya Pradesh
~5,000
~6,000
~5,500
~4,500
~4,000
~25,000
Rajasthan
~4,000
~5,000
~4,500
~4,000
~3,500
~21,000
Karnataka
765
918
~800
~700
~600
~3,783
Tamil Nadu
520
470
160
~400
~300
~1,850
Kerala
100
144
200
~150
~100
~694
North-East (Total)
~5,000
~6,000
~5,500
~5,000
~4,000
~25,500
India Total
~1,00,000
~1,10,000
~1,05,000
~95,000
~80,000
~4,90,000+
Notes: Data from Lok Sabha annexures/PIB; FY25 partial. Central share funds construction (₹19,000 Cr FY26 budget). States like Bihar/UP get priority for backlog habitations.
Summary
Aspect
Key Points
Population
65-70% rural; young demographic; spread over 6.4 lakh villages
Around 70-75%; gender gap persists; improving infrastructure
Income Source
Agriculture, allied activities, government schemes, non-farm jobs
Expenditure Pattern
Mostly on food; rising non-food spend; telecom and lifestyle products growing
Rural Demand & Consumption
Basic goods dominate; rising demand for durables and branded products
Rural Housing
Mix of kutcha and pakka houses; improving quality via government schemes
Education
Increased access; uneven quality; vocational training emerging
Electricity
Widespread electrification; supply still a challenge in some areas
Roads
Improved rural road connectivity boosting market access and distribution
In conclusion:
The Indian rural market is vast and evolving, with increasing literacy, income diversification, infrastructure development, and changing consumption patterns. Marketers targeting rural India must understand these demographic and socioeconomic factors to design effective strategies.